Contributions to vital statistics : especially designed to elucidate the rate of mortality, the laws of sickness, and the influences of trade and locality on health, derived from an extensive collection of original data, supplied by Friendly Societies, and proving their too frequent instability / by F.G.P. Neison.
- F. G. P. Neison
- Date:
- [1845]
Licence: Public Domain Mark
Credit: Contributions to vital statistics : especially designed to elucidate the rate of mortality, the laws of sickness, and the influences of trade and locality on health, derived from an extensive collection of original data, supplied by Friendly Societies, and proving their too frequent instability / by F.G.P. Neison. Source: Wellcome Collection.
Provider: This material has been provided by The Royal College of Surgeons of England. The original may be consulted at The Royal College of Surgeons of England.
11/56 page 11
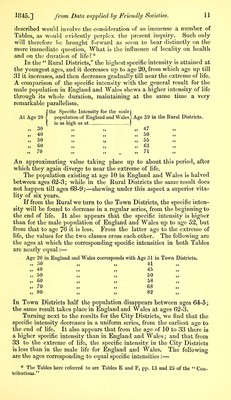
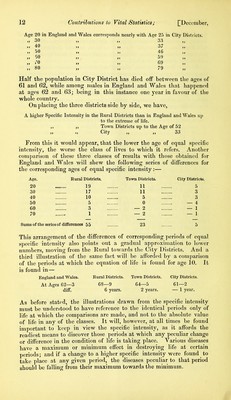
![described would involve the consideration of so immense a number of Tables, as would evidently perplex the present inquiry. Such only will therefore be brought forward as seem to bear distinctly on the more immediate question, What is the influence of locality on health and on the duration of life?* In the “ Rural Districts,” the highest specific intensity is attained at the youngest ages, and it decreases up to age 20, from which age up till 31 it increases, and then decreases gradually till near the extreme of life. A comparison of the specific intensity with the general result for the male population in England and Wales shews a higher intensity of life through its whole duration, maintaining at the same time a very remarkable parallelism. (the Specific Intensity for the male] population of England and Wales > Age 39 in the Rural Districts. „ 30 is as high as at.... yy ) yy 47 yy „ 40 yy yy yy 50 yy „ 50 yy yy yy 55 yy „ 60 yy yy yy 63 » 70 yy yy yy 71 n An approximating value taking place up to about this period, after which they again diverge to near the extreme of life. The population existing at age 10 in England and Wales is halved between ages 62-3; while in the Rural Districts the same result does not happen till ages 68-9;—shewing under this aspect a superior vita- lity of six years. If from the Rural we turn to the Town Districts, the specific inten- sity will be found to decrease in a regular series, from the beginning to the end of life. It also appears that the specific intensity is higher than for the male population of England and Wales up to age 52, but from that to age 76 it is less. From the latter age to the extreme of life, the values for the two classes cross each other. The following are the ages at which the corresponding specific intensities in both Tables are nearly equal:— Age 20 in England and Wales corresponds with Age 31 in Town Districts. » 30 yy yy 41 yy » 40 yy yy 45 yy „ 50 yy ,, 50 yy „ 60 yy yy 58 yy „ 70 yy yy 63 yy „ 80 yy yy 82 „ In Town Districts half the population disappears between ages 64-5; the same result takes place in England and Wales at ages 62-3. Turning next to the results for the City Districts, we find that the specific intensity decreases in a uniform series, from the earliest age to the end of life. It also appears that from the age of 10 to 33 there is a higher specific intensity than in England and Wales; and that from 33 to the extreme of life, the specific intensity in the City Districts is less than in the male life for England and Wales. The following are the ages corresponding to equal specific intensities:— * The Tables here referred to are Tables E and F, pp. 13 and 25 of the “ Con- tributions.”](https://iiif.wellcomecollection.org/image/b22329213_0013.jp2/full/800%2C/0/default.jpg)