Report of the Commissioners appointed to inquire into the regulations affecting the sanitary condition of the army, the organization of military hospitals, and the treatment of the sick and wounded ; with evidence and appendix. Presented to both Houses of Parliament by Command of Her Majesty.
- Great Britain. Royal Commission Appointed to Inquire into the Sanitary Condition of the Army.
- Date:
- 1858
Licence: Public Domain Mark
Credit: Report of the Commissioners appointed to inquire into the regulations affecting the sanitary condition of the army, the organization of military hospitals, and the treatment of the sick and wounded ; with evidence and appendix. Presented to both Houses of Parliament by Command of Her Majesty. Source: Wellcome Collection.
Provider: This material has been provided by London School of Hygiene & Tropical Medicine Library & Archives Service. The original may be consulted at London School of Hygiene & Tropical Medicine Library & Archives Service.
20/978 page 12
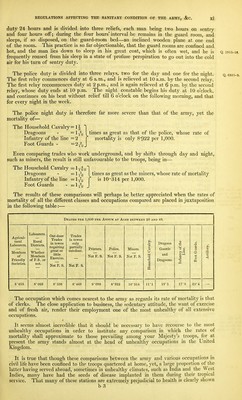
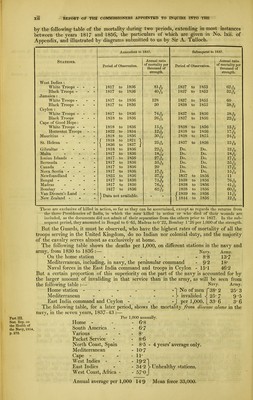
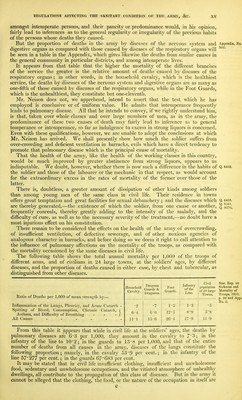
![by the following table of the mortality during two periods, extending in most instances between the years 1817 and 1856, the particulars of which are given in No. Ixii. of Appendix, and illustrated by diagrams submitted to us by Sir A. Tulloch. OTATIONS. Antecedent to 1837. Subsequent to 1837. Period of Observation. Annual ratio of mortality per l.LlUUaaiiU. UI strength. Period of Observation. Annual ratio of mortality per thousand of strenjTth West Indies : White Troops - 1817 to 1836 1837 to 1853 62^ Black Troops - - 1817 to 1836 1837 to 1853 32A Jamaica : White Troops - - - 1817 to 1836 128 1837 to 1855 60 Black Troops - 1817 to 1836 30 1838 to 1855 Ceylon : White Troops - 1817 to 1836 1837 to 1856 38A Black Troops - - - 1818 to 1836 26A 1837 to 1856 22tV Cape of Good Hope: White Troops - - 1818 to 1836 15^ 1838 to 1856 Hottentot Troops 1822 to 1834 1838 to 1856 Mauritius - - - - 1818 to 1836 1838 to 1855 St. Helena - r 1818 I 1836 to to 1821 1 1837 i 1837 to 1856 Gibraltar - - - - 1818 to 1836 Do. Do. TOO Malta - . - 1817 to 1836 Do. Do. Ionian Islands - - - 1817 to 1836 27A Do. Do. Bermuda _ - _ 1817 to 1836 35-1^ Do. Do. 35A Canada - - - - 1817 to 1836 20 Do. Do. Nova Scotia - 1817 to 1836 Do. Do. 15tV Newfoundland - - - 1825 to 1836 1837 to 1856 11 Bengal - - - - 1817 to 1836 1838 to 1856 76-1^ Madras - - - 1817 to 1836 76tV 1838 to 1856 Bombay - 1817 to 1836 1838 to 1856 Van Diemen's Land New Zealand - 1 Data not available. / 1839 I 1844 to to 1856 1856 10 8 Part in. Stat. Hep. on the Health of the Navy, 1854, p. 272. These are exclusive of killed in action, so far as they can be ascertained, except as regards the returns from the three Presidencies of India, in which the men killed in action or who died of their wounds are included, as the documents did not admit of their separation from the others prior to 1837. In the sub- sequent period, they amounted in Bengal to 6'65, Madras toO'22, Bombay 1 '26 per 1,000 of the strength. But the Guards, it must be observed, who have the highest rates of mortality of all the troops serving in the United Kingdom, do no Indian nor colonial duty, and the majority of the cavalry serves almost as exclusively at home. The following table shows the deaths per 1,000, on different stations in the navy and army, from 1830 to 1836:— Navy. Army. On the home station - 8*8 13*7 Mediterranean, including, in navy, the peninsular command - 9'2 18* Naval forces in the East India command and troops in Ceylon - 15*1 46*2 But a certain proportion of this superiority on the part of the navy is accounted for by the larger amount of invaliding in that service than in the army, as will be seen from the following table :— Navy. Army. Home station - - - - - -1 No of men C38* 2 25* 3 Mediterranean - - - - - ?> invalided -^ 25-7 9 '5 East India command and Ceylon - - -J per 1,000. [ 33* 6 3 6 The following table, for a later period, shows the mortality Jroyn disease alone in the navy, in the seven years, 1837-43 :— Per 1,000 annually. Home - South America Various Packet Service North Coast, Spain Mediterranean Cape - West Indies - East Indies West Coast, Africa 6-8 6-7 8- 8-6 8*5-4 years' average only. 107 11- 19-2 ■] 34-2 > Unhealthy stations. 57-oJ Annual average per 1,000 14*9 Mean force 33,000.](https://iiif.wellcomecollection.org/image/b21365210_0020.jp2/full/800%2C/0/default.jpg)