[Report 1960] / Medical Officer of Health, Ince-in-Makerfield U.D.C.
- Ince-in-Makerfield (England). Urban District Council.
- Date:
- 1960
Licence: Attribution 4.0 International (CC BY 4.0)
Credit: [Report 1960] / Medical Officer of Health, Ince-in-Makerfield U.D.C. Source: Wellcome Collection.
10/34 page 6
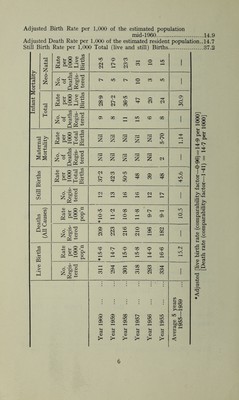
![Adjusted Birth Rate per 1,000 of the estimated population mid-1960 14.9 Adjusted Death Rate per 1,000 of the estimated resident population.. 14.7 Still Birth Rate per 1,000 Total (live and still) Births 37.2 Infant Mortality Neo-Natal Rate per 1000 Live Births 22-5 170 CO CO 05 CO o LO 1 No. of Deaths Regis- tered 1/5 l> o CO L/5 1 ' Total Rate per 1000 Live Births 05 oo 05 05 05 36*5 20 Tf 05 30.9 No. of Deaths Regis- tered 05 X T—< ID CD X i Maternal Mortality Rate per 1000 Total Births 2 Nil 2 Nil 2 5-70 1 i | 1.14 No. of Deaths Regis- tered Nil i 2 2 Nil 2 05 i c/ X- »- S 4- Cf > < Rate per 1000 Total Births 05 CO 42-3 50*5 48 CO 1 48 xD »o 1 ) ) No. Regis- tered 05 CO CD CD 05 i>* 1 Deaths (All Causes) Rate per 1000 pop’n I *10-5 11-2 GO © GO 9-7 9-1 VO O No. Regis- tered 209 223 216 210 196 i 05 X 1 c/5 rC 4-» u s Rate per 1000 pop’n cp 1/5 * 14-7 15-0 15-8 14-0 16-6 15.2 <u . c/5 ’’d T _ CO co o-Sb£ T—( 05 o 05 co i & V <U CO 05 CO CO 05 CO 1 P4 -*-* (/> * U 05 aj i/5 « 05 o 05 X CD 1/5 lO | CD 1/5 1/5 lO l/5 m uo 05 05 05 05 05 05 i-H y—1 i—1 b£a5 (-i U U U U l-i 03 Oj Oj aj aj aj aj <U 0) <u 05 0) O) <U > >h >« >* < Adjusted [live birth rate (comparability factor—0*96) = 14-9 per 1000] [Death rate (comparability factor—1*41) = 14-7 per 1000]](https://iiif.wellcomecollection.org/image/b29495520_0010.jp2/full/800%2C/0/default.jpg)