Review of recent cancer research / by E.F. Bashford.
- Bashford, E. F. (Ernest Francis), 1873-
- Date:
- 1914
Licence: Public Domain Mark
Credit: Review of recent cancer research / by E.F. Bashford. Source: Wellcome Collection.
Provider: This material has been provided by the Augustus C. Long Health Sciences Library at Columbia University and Columbia University Libraries/Information Services, through the Medical Heritage Library. The original may be consulted at the the Augustus C. Long Health Sciences Library at Columbia University and Columbia University.
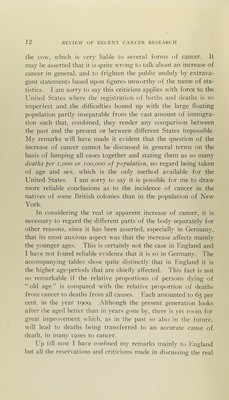
21/48 (page 13)
![or apparent increase of cancer in that country apply with added force to all other countries. In Greece, Portugal. Turkey, and Russia, no statistics exist. For France. Denmark, Sweden, Roumania, and Bulgaria they are compiled only for the towns. Death-rates per i,ooo Persons Living, iSSi-igog Countries (Arranged in Order of Crude Rates in 1901-5) Switzerland The Netherlands . . . . England and Wales .. Scotland Austria Victoria Ireland New Zealand South Australia Prussia New South Wales . . . Belgium Queensland Tasmania Italy Ontario, Province of. Western Australia. . . Spain Hungary Servia Crude Rates Corrected Rates 1881- 1886- 1891- 1896- I90I- 1901- 1906 1907 1908 1909 1885 1890 i89r -1900 1905 1905 1.03 1.14 1.22 1.27 1.30 1.10 1.12 1.06 I.II 0.60 0.70 0.81 0.92 0.97 0.85 0.88 0.89 .0.90 0.92 0.90 0-55 0.63 0.71 0.80 0.86 0.86 0.92 0.91 0.95 0.54 0.62 0.69 0.77 0.84 0.83 0.94 0.94 0.94 — 0.44 0.50 0.59 0.69 0.74 0.69 0.73 0.72 0.72 — 0.45 0.53 0.62 0.69 0.74 0.76 0.77 0.82 0.81 0.82 0.38 0.43 0.49 0.58 0.69 0.56 0.64 0.62 0.62 0.65 0.30 0.42 0.52 0.59 0.67 0.75 0.79 0.82 0.79 0.82 0.32 0.39 0.48 0.56 0.67 0.76 0.84 0.80 0.77 0.86 0.34 0.41 0.50 0.57 0.6s 0.64 0.69 0.72 0.73 0.74 0.27 0.36 0.43 0.54 0.64 0.80 0.85 0.87 0.84 0.90 — — — — 0.582 0.49 0.49 0.51 0.54 — 0.25 0.27 jo.34 0.44 0.57 0.79 0.76 0.90 0.71 0.83 — 0.49 0.49 0.5s 0.56 0.68 0.63 0.77 0.82 0.82 — 0.43' 0.44 0.51 0.5s 0.45 0.51 0.50 0.53 0.53 0.21 0.29 ? 0.44' 0.52 — — — — — 0.33 0.41 0.31 0.31 0.45 0.74 0.98 0.83 0.86 1.09 — — — — 0.44 0.38 0.41 0.41 0.44 0.44 — , — — o.30> 0.39 0.38 0.39 0.41 0.42 0.43 — — 0.061 0.08 O.IO — — — — — Therefore only the crudest comparison on the basis of the num- ber of deaths per looo li\'ing is ])(issil)le, and it is pn)hable that this comparison as set out in the accompanying ta])le is valueless. In all probability the figures in this table illustrate simply the degree of the development of the statistics of the several coun- tries and do not reveal real differences in the incidence of cancer. Read from above, downwards, they indicate the increasing worth- lessness of the statistics from Switzerland, where a compulsory medical inspection of the dead obtains, to Ser\ia where they probably have no value at all. l\ead from left to right, they in- dicate mainlv the impro\-ement in the statistics of each Cf^untry. The figures for tlie Tnited Slates ha\e been .already referred to. Allhougli comparisons l)(.-l\\een lnropcan cnnniiirs are use- ^ Four years. - 3 years.](https://iiif.wellcomecollection.org/image/b21228991_0021.jp2/full/800%2C/0/default.jpg)