Report of the Committee on the Economic and Financial Problems of the Provision for Old Age.
- Great Britain. Committee on the Economic and Financial Problems of the Provision for Old Age.
- Date:
- [1954]
Licence: Public Domain Mark
Credit: Report of the Committee on the Economic and Financial Problems of the Provision for Old Age. Source: Wellcome Collection.
111/128 (page 105)
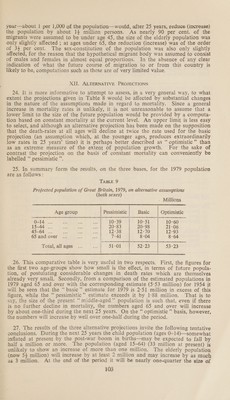
![Thousands Period Table 7 ** Lower ”’ “* Higher ”’ 1954-59 735 728 742 1959-64 705 684 726 1964-69 705 670 740 1969-74 W225 674 776 1974-79 720 654 788 the 1979 level. TABLE 11 In each case it has been Millions Year 2004 Age Group Males 0-14 a: 4:36 5:14 5:98 15-44 9-67 10:48 11-33 45-64 He 6°70 6°72 6:74 65 and over... 3°31 3°31 3°31 Total 24:04 25°65 27-36 Females 0-14 4-12 4-86 5:66 15-44 9-23 10-01 10°81 45-64 6°72 6:74 6°76 65 and over 4°57 4°57 4:57 Total 24-64 26°18 27°80 Males and Females - xv P 8°48 10-00 11-64 15-44 18-90 20-49 22°14 45-64 13°42 13°46 13-50 65 and over... 7°88 7°88 7°88 Total 48-68 51-83 55°16 3-81 4-93 6-25 8-47. | 40:07 | 11-84 5-9] 6-43 6-96 3-56 3-61 3-66 21-75 | 25-04 | 28-71 3-61 4-67 5-91 8-08 eco. [11-28 5-87 6-39 6-91 4-72 4-78 4-84 22:28 | 25-44 | 28-94 7-42 9:60. | 12:16 1655 19-67 | 23-12 11-78 12-82 | 13-87 8-28 8-39 8-50 Wags 1 450-48 | 57-65 Year 2029 Year 2004 Year 2029 Age Group “* Lower ” ** Higher ” ‘* Lower ” ** Higher ” 0-14... —15 per cent. +16 per cent. — 23 per cent. +27 per cent. 15-44... — 8 percent. + 8 percent. —16 per cent. +18 per cent. 45-64... : negligible negligible — 8 percent. + 8 percent. 65 and over ... no change no change — 1 percent. + 1 percent. All ages — 6percent. + 6percent. —13 per cent. +14 per cent. 105 30482 F 99](https://iiif.wellcomecollection.org/image/b32176880_0111.jp2/full/800%2C/0/default.jpg)