[Report 1954] / Medical Officer of Health, Ashton-under-Lyne Borough.
- Ashton-under-Lyne (England). Borough Council.
- Date:
- 1954
Licence: Attribution 4.0 International (CC BY 4.0)
Credit: [Report 1954] / Medical Officer of Health, Ashton-under-Lyne Borough. Source: Wellcome Collection.
10/52 page 8
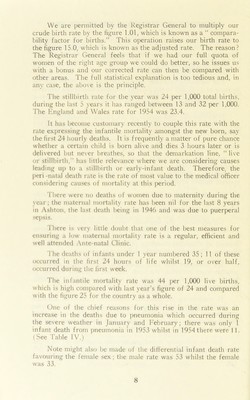
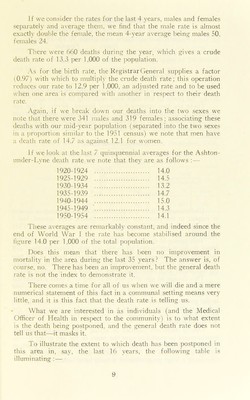
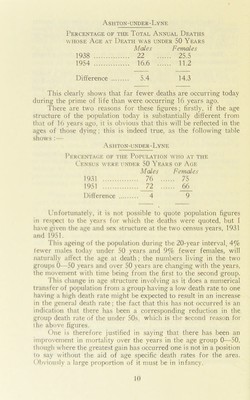
![We are permitted by the Registrar General to multiply our crude birth rate by the figure 1.01, which is known as a “ compara- bility factor for births.” This operation raises our birth rate to the figure 15.0, which is known as the adjusted rate. The reason? The Registrar General feels that if we had our full quota of women of the right age group we could do better, so he issues us with a bonus and our corrected rate can then be compared with other areas. The full statistical explanation is too tedious and, in any case, the above is the principle. The stillbirth rate for the year was 24 per 1,000 total births, during the last 5 years it has ranged between 13 and 32 per 1,000. Fhe England and Wales rate for 1954 was 23.4. It has become customary recently to couple this rate with the rate expressing the infantile mortality amongst the new born, say the first 24 hourly deaths. It is frequently a matter of pure chance whether a certain child is born alive and dies 3 hours later or is delivered but never breathes, so that the demarkation line, “ live or stillbirth, has little relevance where we are considering causes leading up to a stillbirth or early-infant death. Therefore, the peri -natal death rate is the rate of most value to the medical officer considering causes of mortality at this ]>eriod. There were no deaths of women due to maternity during the year; the maternal mortality rate has been nil for the last 8 years in Ashton, the last death being in 1946 and was due to puerperal sepsis. Tberc is very little doubt that one of the best measures for ensuring a low maternal mortality rate is a regular, efficient and well attended Ante-natal Clinic. The deaths of infants under 1 year numbered 35; 11 of these occurred in the first 24 hours of life whilst 19, or over half, occurred during the first week. 'The infantile mortality rate was 44 per 1,000 live births, which is high compared with last year’s figure of 24 and compared with the figure 25 for the country as a whole. One of the chief reasons for this rise in the rate was an increase in the deaths due to pneumonia which occurred during the severe weather in January and February; there was only 1 infant death from pneumonia in 1953 whilst in 1954 there were 11. (See Table IV.) Note might also be made of the differential infant death rate favouring the female sex ; the male rate was 53 whilst the female was 33.](https://iiif.wellcomecollection.org/image/b28812943_0010.jp2/full/800%2C/0/default.jpg)