[Report 1953] / Medical Officer of Health, Tynemouth County Borough.
- Tynemouth (England). County Borough Council.
- Date:
- 1953
Licence: Attribution 4.0 International (CC BY 4.0)
Credit: [Report 1953] / Medical Officer of Health, Tynemouth County Borough. Source: Wellcome Collection.
12/62 (page 2)
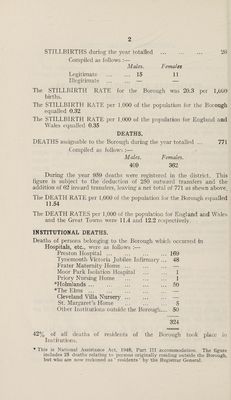
![STILLBIRTHS during the year totalled ... ... ... 26 Compiled as follows :— Males. Females Legitimate ... ... 15 11 Illegitimate ... ... — — The STILLBIRTLI RATE for the Borough was 20.3 per 1,000 births. The STILLBIRTH RATE per 1,000 of the population for the Borough equalled 0.32 The STILLBIRTH RATE per 1,000 of the population for England and Wales equalled 0.35 DEATHS. DEATHS assignable to the Borough during the year totalled ... 771 Compiled as follows :— Males. Females. 409 362 During the year 959 deaths were registered in the district. This figure is subject to the deduction of 250 outward transfers and the addition of 62 inward transfers, leaving a net total of 771 as shewn above. The DEATH RATE per 1,000 of the population for the Borough equalled 11.54 The DEATH Rx\TES per 1,000 of the population for England and Wales and the Great Towns were 11.4 and 12.2 respectively. INSTITUTIONAL DEATHS. Deaths of persons belonging to the Borough which occurred in Hospitals, etc., were as follows :— Preston Hospital ... ... ... ... 169 Tynemouth Victoria Jubilee Infirmary ... 48 Frater Maternity Home ... Moor Park Isolation Hospital ... ... 1 Priory Nursing Home ... ... ... 1 *Holm]ands.50 *The Elms . Cleveland Villa Nursery St. Margaret's Home ... ... ... 5 Other Institutions outside the Borough.... 50 324 42% of all deaths of residents of the Borough took place in Institutions. * This is National Assistance Act, 1948, Part III accommodation. The figure includes 25 deaths relating to persons originally residing outside the Borough, but who are now reckoned as ‘ residents ’ by the Registrar General.](https://iiif.wellcomecollection.org/image/b30199049_0012.jp2/full/800%2C/0/default.jpg)