[Report of the Medical Officer of Health for London County Council 1894].
- London County Council (London, England). County of London.
- Date:
- [1895?]
Licence: Attribution-NonCommercial 4.0 International (CC BY-NC 4.0)
Credit: [Report of the Medical Officer of Health for London County Council 1894]. Source: Wellcome Collection.
17/229 (page 9)
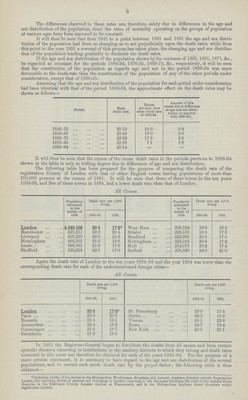
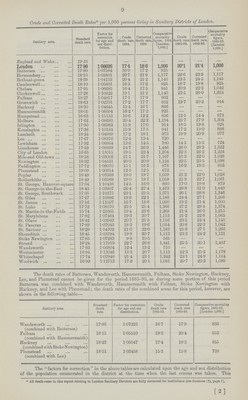
![9 Crude and Corrected Death Rates* per 1,000 persons living in Sanitary Districts of London. Sanitary area. Standard death rate. Factor for correction for age and sex distri bution. Crude death rate, 1894. Corrected death rate 1894. Comparative mortality figure, 1894. [London 1,000.] Crude death rate 1885-93. Corrected death rate 1885-93. Comparative mortality figure. 1885-93. [London 1,000.] England and Wales 19.15 — — — — — — — London 17.96 1.06626 174 186 1,000 20.1 21.4 1,000 Battersea 17.80 1.07584 16.0 17.2 925 — — — Bermondsey 18.10 1.05801 20.7 21.9 1,177 22.6 23.9 1,117 Bethnal-green 18-39 1.04133 20.4 21.2 1,140 23.5 24.5 1,145 Camberwell 18.10 1.05801 16.3 17.2 925 18.7 19.8 925 Chelsea 17.95 1.06685 16.4 17.5 941 20.9 22.3 1,042 Clerkenwell 17.28 1.10822 19.1 21.2 1,140 23.5 26.0 1,215 Fulham 18.27 1.04817 17.1 17.9 962 — — — Greenwich 18.63 1.02791 17.2 17.7 952 19.7 20.2 944 Hackney 18.30 1.04645 15.4 16.1 866 — — — Hammersmith 18.05 1.06094 16.2 17.2 925 — — — Hampstead 16.63 1.15153 10.6 12.2 656 12.5 14.4 673 Holborn 17.62 1.08683 20.4 22.2 1,194 25.7 27.9 1,304 Islington 17.90 1.06983 15.9 17.0 914 18.5 19.8 925 Kensington 17.38 1.10184 15.9 17.5 941 17.2 19.0 888 Lambeth 18.24 1.04989 17.2 18.1 973 19.9 20.9 977 Lee 17.67 1.08376 12.4 13.4 720 — — — Lewisham 17.92 1.06864 13.6 14.5 780 14.5 15.5 724 Limehouse 17.59 1.08869 24.7 26.9 1,446 26.0 28.3 1,322 City of London 16.65 1.15015 19.5 22.4 1,204 22.3 26.2 1,224 Mile-end Old-town 18.58 1.03068 21.1 21.7 1,167 21.3 22.0 1,028 Newington 18.32 1.04531 20.0 20.9 1,124 22.5 23.5 1,098 Paddington 17.72 1.08070 15.1 16.3 876 16.9 18.3 855 Plumstead 19.09 1.00314 12.5 12.5 672 — — — Poplar 18.49 1.03569 19.0 19.7 1,059 21.2 22.0 1,028 Rotherhithe 18.49 1.03569 19.0 19.7 1,059 21.9 22.7 1,061 St. George, Hanover-square 17.34 1.10438 14.5 16.0 860 17.0 18.8 879 St. George-in-the-East 18.43 1.03907 26.4 27.4 1,473 29.8 31.0 1,449 St. George, Southwark 17.35 1.10375 23.1 25.5 1,371 26.1 28.8 1,346 St. Giles 17.27 1.10886 19.9 22.1 1,188 24.4 27.1 1,266 St. James 17.16 1.11597 16.7 18.6 1,000 19.2 21.4 1,000 St. Luke 17.72 1.08070 23.5 25.4 1,366 27.2 29.4 1,374 St. Martin-in-the-Fields 15.74 1.21665 19.4 23.6 1,269 21.4 26.0 1,215 St. Marylebone 17.82 1.07464 19.3 20.7 1,113 21.2 22.8 1,065 St. Olave 18.42 1.03963 20.7 21.5 1,156 23.5 24.4 1,140 St. Pancras 17.89 1.07043 18.3 19.6 1,054 20.8 22.3 1,042 St. Saviour 18.29 1.04702 21.0 22.0 1,183 25.9 27.1 1,266 Shoreditch 18.45 1.03794 19.9 20.7 1,113 23.3 24.2 1,131 Stoke Newington 17.85 1.07283 9.8 10.5 565 — — — Strand 16.24 1.17919 22.7 26.8 1,441 25.5 30.1 1,407 Wandsworth 17.93 1.06804 12.4 13.2 710 — — — Westminster 16.94 1.13046 18.3 20.7 1,113 22.3 25.2 1,178 Whitechapel 17.74 1.07948 21.4 23.1 1,242 23.1 24.9 1,164 Woolwich 16.99 1.12713 17.8 20.1 1,081 20.7 23.3 1,089 The death rates of Battersea, Wandsworth, Hammersmith, Fulham, Stoke Newington, Hackney, Lee, and Plumstead cannot be given for the period 1885—93, as during some portion of this period Battersea was combined with Wandsworth, Hammersmith with Fulham, Stoke Newington with Hackney, and Lee with Plumstead; the death rates of the combined areas for this period, however, are shown in the following table— Sanitary area. Standard death rate. Factor for correction for age and sex distribution. Crude death rate 1885-93. Corrected death rate 1885-93. Comparative mortality figure, 1885-93. [London 1,000.] Wandsworth (combined with Battersea) 17.86 1.07223 16.7 17.9 836 Fulham (combined with Hammersmith) 18.-15 1.05510 19.3 20.4 953 Hackney (combined with Stoke Newington) 18.23 1.05047 17.4 18.3 855 Plumstead (combined with Lee) 18.51 1.03458 15.3 15.8 738 The factors for correction in the above tables are calculated upon the age and sex distribution of the population enumerated in the district at the time when the last census was taken. This * All death-rates in this report relating to London Sanitary Districts are fully corrected for institutions (see footnote (†), page 7). [2]](https://iiif.wellcomecollection.org/image/b18252436_0017.jp2/full/800%2C/0/default.jpg)