Cholera in relation to certain physical phenomena : a contribution towards the special enquiry sanctioned by the Right Hon. the Secretaries of State for War and for India / by T.R. Lewis and D.D. Cunningham.
- Timothy Richards Lewis
- Date:
- 1878
Licence: Public Domain Mark
Credit: Cholera in relation to certain physical phenomena : a contribution towards the special enquiry sanctioned by the Right Hon. the Secretaries of State for War and for India / by T.R. Lewis and D.D. Cunningham. Source: Wellcome Collection.
Provider: This material has been provided by The Royal College of Surgeons of England. The original may be consulted at The Royal College of Surgeons of England.
21/146 page 11
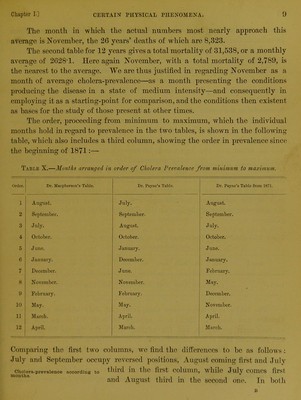
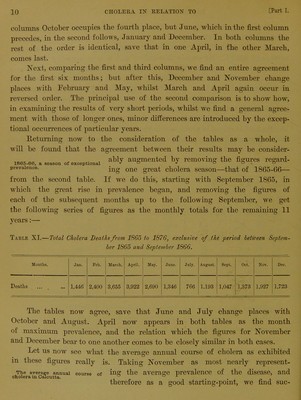
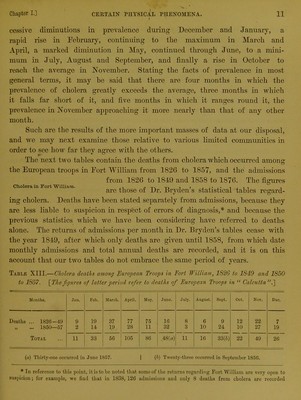
![Chapter I.] CERTAIN PHYSICAL PHENOMENA. I ' 11 cessive diminutions in prevalence during December and January, a rapid rise in February, continuing to the maximum in March and April, a marked diminution in May, continued through June, to a mini- mum in July, August and September, and finally a rise in October to reach the average in November. Stating the facts of prevalence in most general terms, it may he said that there are four months in which the prevalence of cholera greatly exceeds the average, three months in which it falls far short of it, and five months in which it ranges round it, the prevalence in November approaching it more nearly than that of any other month. Such are the results of the more important masses of data at our disposal, and we may next examine those relative to various limited communities in order to see how far they agree with the others. The next two tables contain the deaths from cholera which occurred among the European troops in Fort William from 1826 to 1857, and the admissions from 1826 to 1849 and 1858 to 1876. The figures are those of Dr. Bryden’s statistical tables regard- ing cholera. Deaths have been stated separately from admissions, because they are less liable to suspicion in respect of errors of diagnosis,* and because the previous statistics which we have been considering have referred to deaths alone. The returns of admissions per month in Dr. Bryden’s tables cease with the year 1849, after which only deaths are given until 1858, from which date monthly admissions and total annual deaths are recorded, and it is on this account that our two tables do not embrace the same period of years. Cholera in Fort William. Table XIII.—Cholera deaths among European Troops in Fort William, 1S26 to 1S49 and 1850 to 1857. [The figures of latter period refer to deaths of European Troops in “ Calcutta”.] Months. Jan. Feb. M arch. April. May. Juno. July. August. Sept. Oct. Nov. Dec. Deaths ... 1826-49 9 19 37 77 75 16 8 6 9 12 22 7 „ ... 1850—57 2 14 19 28 11 32 3 10 24 10 27 19 Total 11 33 56 105 86 48(a) 11 16 33(5) 22 49 26 (a) Thirty-one occurred in June 1857. | (A) Twenty-three occurred in September 1856. * In reference to this point, it is to he noted that some of the returns regarding Fort William are very open to](https://iiif.wellcomecollection.org/image/b22322255_0023.jp2/full/800%2C/0/default.jpg)
 No text description is available for this image
 No text description is available for this image
 No text description is available for this image