Cholera in relation to certain physical phenomena : a contribution towards the special enquiry sanctioned by the Right Hon. the Secretaries of State for War and for India / by T.R. Lewis and D.D. Cunningham.
- Timothy Richards Lewis
- Date:
- 1878
Licence: Public Domain Mark
Credit: Cholera in relation to certain physical phenomena : a contribution towards the special enquiry sanctioned by the Right Hon. the Secretaries of State for War and for India / by T.R. Lewis and D.D. Cunningham. Source: Wellcome Collection.
Provider: This material has been provided by The Royal College of Surgeons of England. The original may be consulted at The Royal College of Surgeons of England.
23/146 page 13
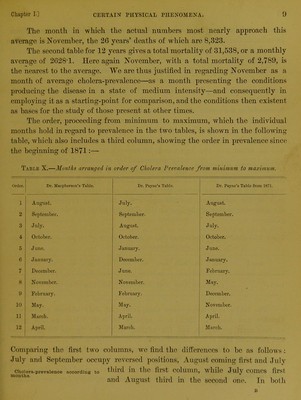
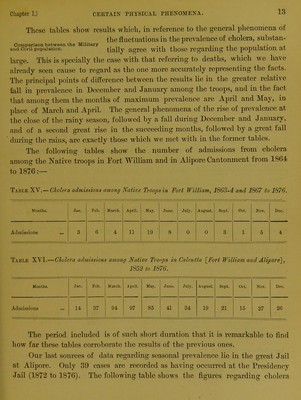
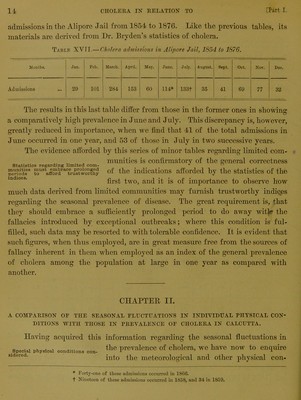
![These tables show results which, in reference to the general phenomena oi the fluctuations in the prevalence of cholera, substan- Comparisonbetween the Military ... l x* x aud civil population. tially agree with those regarding the population at large. This is specially the case with that referring to deaths, which we have already seen cause to regard as the one more accurately representing the facts. The principal points of difference between the results lie in the greater relatii e fall in prevalence in December and January among the troops, and in the fact that among them the months of maximum prevalence are April and May, in place of March and April. The general phenomena of the rise of prevalence at the close of the rainy season, followed by a fall during December and January, and of a second great rise in the succeeding months, followed by a great fall during the rains, are exactly those which we met with in the former tables. The following tables show the number of admissions from cholera among the Native troops in Tort William and in Alipore Cantonment from 1864 to 1876:— Table XV.— Cholera admissions among Native Troops in Tort William, 1863-4 and 1867 to 1876. Months. Jan. Feb. March. April. May. June. July. August. Sept. Oct. Nov. Dec. Admissions 3 6 4 11 19 8 0 0 3 1 5 4 Table XYI.— Cholera admissions among Native Troops in Calcutta [Fort William and Alipore], 1852 to 1876. Months. Jan. Feb. March. April. May. June. July. August. Sept. Oct. Nov. Dec. Admissions 14 37 94 97 85 41 34 19 21 15 27 26 The period included is of such short duration that it is remarkable to find how far these tables corroborate the results of the previous ones. Our last sources of data regarding seasonal prevalence lie in the great Jail at Alipore. Only 39 cases are recorded as having occurred at the Presidency Jail (1872 to 1876). The following table shows the figures regarding cholera](https://iiif.wellcomecollection.org/image/b22322255_0025.jp2/full/800%2C/0/default.jpg)
 No text description is available for this image
 No text description is available for this image
 No text description is available for this image