Cholera in relation to certain physical phenomena : a contribution towards the special enquiry sanctioned by the Right Hon. the Secretaries of State for War and for India / by T.R. Lewis and D.D. Cunningham.
- Timothy Richards Lewis
- Date:
- 1878
Licence: Public Domain Mark
Credit: Cholera in relation to certain physical phenomena : a contribution towards the special enquiry sanctioned by the Right Hon. the Secretaries of State for War and for India / by T.R. Lewis and D.D. Cunningham. Source: Wellcome Collection.
Provider: This material has been provided by The Royal College of Surgeons of England. The original may be consulted at The Royal College of Surgeons of England.
26/146 page 16
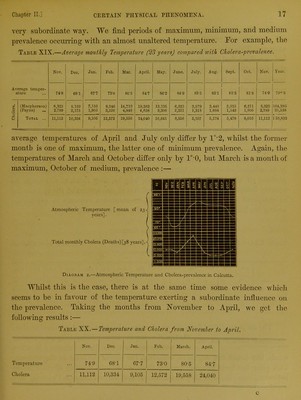
![It will be observed that in both table and diagram the months are arranged starting from November, in place of from the commencement of the calendar year. The same arrangement has been followed in the subsequent tables and diagrams in connection with Calcutta. The arrangement was adopted because November, as the month of average prevalence, forms a good starting point for comparison; but other advantages also attend it, one of which is that, so far as the phenomena of rainfall are concerned, October makes a more natural termin- ation to the year than December. Atmospheric-pressure curve [9 years] - - -< I Cholera Deaths [38 years] J Diagram i.—Atmospheric-pressure and Cholera-prevalence in Calcutta. The result of the comparison shows that the season of minimum prevalence is T characterised by low atmospheric pressure. Farther minimum prevalence. than this, however, the coincidence ceases. There is no indication of the existence of any definite relation between degree of at- mospheric pressure and prevalence of cholera. December and January, the months of maximum pressure, show less prevalence than November on the one hand, and much less than February, March, April and May on the other. So again June shows lower atmospheric pressure, but much higher prevalence than August and September. Atmospheric pressure, considered in the light of these data, cannot be regarded as exerting any direct influence on the prevalence of cholera. The coincidence of low atmospheric pressure with minimum prevalence must be regarded as such only, or if any influence be exerted by the pressure, it must act through some intermediate agency. (b) Atmospheric Temperature. A mere glance at the table and diagram below renders it evident that tempera- Temperature acts in a subordi- ture’if {t exert an.Y influence on the variations in pre- valence of cholera in Calcutta, does so only in a](https://iiif.wellcomecollection.org/image/b22322255_0028.jp2/full/800%2C/0/default.jpg)


 No text description is available for this image
 No text description is available for this image
 No text description is available for this image