Cholera in relation to certain physical phenomena : a contribution towards the special enquiry sanctioned by the Right Hon. the Secretaries of State for War and for India / by T.R. Lewis and D.D. Cunningham.
- Timothy Richards Lewis
- Date:
- 1878
Licence: Public Domain Mark
Credit: Cholera in relation to certain physical phenomena : a contribution towards the special enquiry sanctioned by the Right Hon. the Secretaries of State for War and for India / by T.R. Lewis and D.D. Cunningham. Source: Wellcome Collection.
Provider: This material has been provided by The Royal College of Surgeons of England. The original may be consulted at The Royal College of Surgeons of England.
27/146 page 17
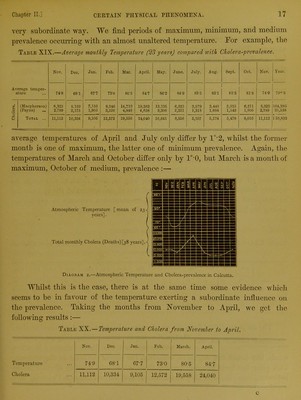
![very subordinate way. We find periods of maximum, minimum, and medium prevalence occurring with an almost unaltered temperature. Eor example, the Table XIX.—Average monthly Temperature (23 years) compared with Cholera-prevalence. Average temper- ature Nov. Dee. Jan. Feb. Mar. April. May. Jane. July. Aug. Sept. Oct. Nov. Year. 74-9 C8-1 67'7 73-u 80-5 84-7 86-2 84-9 83-5 83'1 63-3 81-5 74-9 79°'3 c! (Macpherson) 8,323 8.159 7,160 9,340 14,710 19,382 13,335 6,325 3,979 3,440 3,935 6,211 8,323 104,295 O (Payne) 2,789 2,175 1,955 3,226 4,848 4,658 3,306 2,231 1,31S 1,684 1,543 1,805 2,789 31,538 js Total ... 11,112 10,334 9,105 12,572 19,558 24,010 10,641 8,556 5,297 5,124 5,478 8,016 11,112 1 35,833 average temperatures of April and July only differ by 10,2, whilst the former month is one of maximum, the latter one of minimum prevalence. Again, the temperatures of March and October differ only by 1°'0, but March is a month of maximum, October of medium, prevalence :— Atmospheric Temperature [ mean of 23 J years]. I ( Total monthly Cholera (Deaths)[38 years],< v Diagram 2.—Atmospheric Temperature and Cholera-prevalence in Calcutta. Whilst this is the case, there is at the same time some evidence which seems to be in favour of the temperature exerting a subordinate influence on the prevalence. Taking the months from November to April, we get the following results:— Table XX.—Temperature and Cholera from November to April. Nov. Dec. Jan. Feb. 1 March. April. Temperature 749 68-1 677 73'0 805 OO Cholera 11,112 10,334 9,105 12,672 19,558 24,040 c](https://iiif.wellcomecollection.org/image/b22322255_0029.jp2/full/800%2C/0/default.jpg)


 No text description is available for this image
 No text description is available for this image
 No text description is available for this image