Cholera in relation to certain physical phenomena : a contribution towards the special enquiry sanctioned by the Right Hon. the Secretaries of State for War and for India / by T.R. Lewis and D.D. Cunningham.
- Timothy Richards Lewis
- Date:
- 1878
Licence: Public Domain Mark
Credit: Cholera in relation to certain physical phenomena : a contribution towards the special enquiry sanctioned by the Right Hon. the Secretaries of State for War and for India / by T.R. Lewis and D.D. Cunningham. Source: Wellcome Collection.
Provider: This material has been provided by The Royal College of Surgeons of England. The original may be consulted at The Royal College of Surgeons of England.
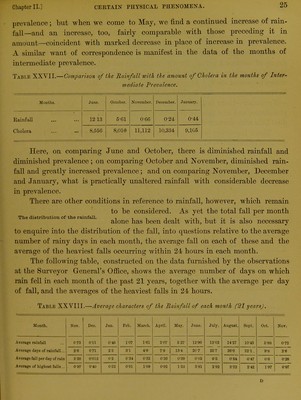
31/146 page 21
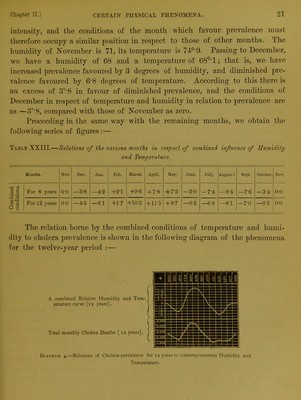
![intensity, and the conditions of the month which favour prevalence must therefore occupy a similar position in resjiect to those of other months. The humidity of November is 71, its temperature is 74°'9. Passing to December, we have a humidity of 68 and a temperature of 68°-l; that is, we have increased prevalence favoured by 3 degrees of humidity, and diminished pre- valence favoured hy 6‘8 degrees of temperature. According to this there is an excess of 30,8 in favour of diminished prevalence, and the conditions of December in respect of temperature and humidity in relation to prevalence are as —3°‘8, compared with those of November as zero. Proceeding in the same way with the remaining months, we obtain the following series of figures :— Table XXIII.—Relations of the various months in respect of combined influence of Humidity and Temperature- Months. Not. Dec. Jan. Feb. March. April. May. June. July. Augus t. Sept. October. Nov. Combined conditions. For 8 years 00 —38 —4-2 +2T +9-6 +7-8 +7-3 —2-0 -7’4 —8'4 —7-6 -34 00 For 12 3rears o-o —45 —6T +1-7 +10-3 + 11-5 + 87 —0-2 —68 —8-1 —7-0 —05 00 The relation borne by the combined conditions of temperature and humi- dity to cholera prevalence is shown in the following diagram of the phenomena for the twelve-year period :— ( A combined Relative Humidity and Tem- perature curve [12 years]. Total monthly Cholera Deaths [ 12 years]. Diagram 4.—Relations of Cholera-prevalence for 12 years to contemporaneous Humidity and Temperature.](https://iiif.wellcomecollection.org/image/b22322255_0033.jp2/full/800%2C/0/default.jpg)
 No text description is available for this image
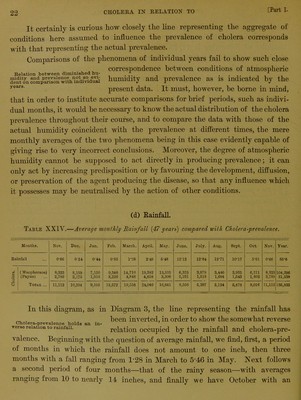
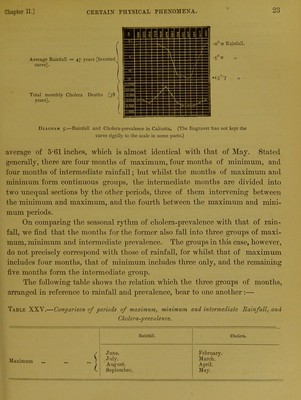
 No text description is available for this image
 No text description is available for this image