Cholera in relation to certain physical phenomena : a contribution towards the special enquiry sanctioned by the Right Hon. the Secretaries of State for War and for India / by T.R. Lewis and D.D. Cunningham.
- Timothy Richards Lewis
- Date:
- 1878
Licence: Public Domain Mark
Credit: Cholera in relation to certain physical phenomena : a contribution towards the special enquiry sanctioned by the Right Hon. the Secretaries of State for War and for India / by T.R. Lewis and D.D. Cunningham. Source: Wellcome Collection.
Provider: This material has been provided by The Royal College of Surgeons of England. The original may be consulted at The Royal College of Surgeons of England.
39/146 page 29
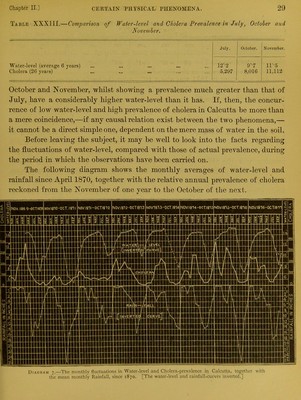
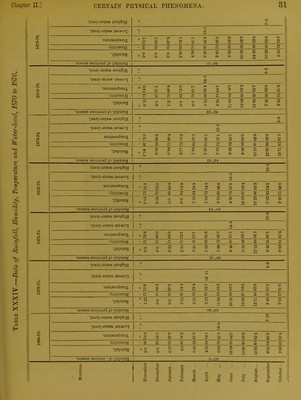
![RAINFAtL IN INCHES Table XXXIII.—Comparison of Water-level and Cholera Prevalence in July, October and Water-level (average 6 years) 12'-2 9 '-7 ir-5 Cholera (26 years) 5,297 8,016 11,112 October and November, whilst showing a prevalence much greater than that of July, have a considerably higher water-level than it has. If, then, the concur- rence of low water-level and high prevalence of cholera in Calcutta be more than a mere coincidence,—if any causal relation exist between the two phenomena,— it cannot be a direct simple one, dependent on the mere mass of water in the soil. Before leaving the subject, it may be well to look into the facts regarding the fluctuations of water-level, compared with those of actual prevalence, during the period in which the observations have been carried on. The following diagram shows the monthly averages of water-level and rainfall since April 1870, together with the relative annual prevalence of cholera reckoned from the November of one year to the October of the next. ! NOV.I86 9-OCTl87«NOV.I8ia-OCT.I81l MOV.I81I-OCTI812 NOV.I812-OCTI813 NOV1813-QCT.I814 NQV.I816-0CT.I81S IMOV.I816-OCT.I811 “ or lEanaii mnnmrnnnnn> — iiuiftiiiHiiiHiisniiiis imnmummuipin —iiTJiiigg— ■■■■■■i Diagram 7.—The monthly fluctuations in Water-level and Cholera-prevalence in Calcutta, together with the mean monthly Rainfall, since 1870. [The water-level and rainfall-curves inverted.]](https://iiif.wellcomecollection.org/image/b22322255_0041.jp2/full/800%2C/0/default.jpg)
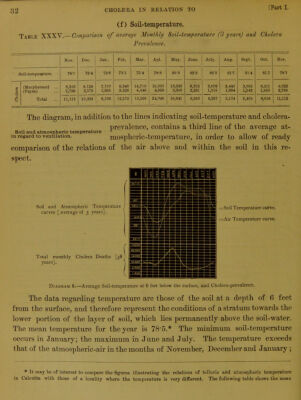
 No text description is available for this image
 No text description is available for this image
 No text description is available for this image