Cholera in relation to certain physical phenomena : a contribution towards the special enquiry sanctioned by the Right Hon. the Secretaries of State for War and for India / by T.R. Lewis and D.D. Cunningham.
- Timothy Richards Lewis
- Date:
- 1878
Licence: Public Domain Mark
Credit: Cholera in relation to certain physical phenomena : a contribution towards the special enquiry sanctioned by the Right Hon. the Secretaries of State for War and for India / by T.R. Lewis and D.D. Cunningham. Source: Wellcome Collection.
Provider: This material has been provided by The Royal College of Surgeons of England. The original may be consulted at The Royal College of Surgeons of England.
44/146 page 34
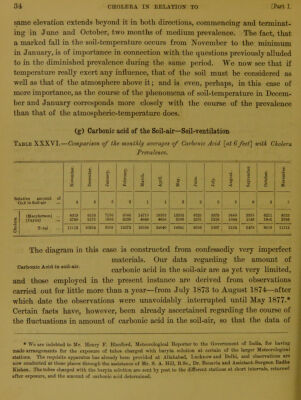
![same elevation extends beyond it in both directions, commencing and terminat- ing in June and October, two months of medium prevalence. The fact, that a marked fall in the soil-temperature occurs from November to the minimum in January, is of importance in connection with the questions previously alluded to in the diminished prevalence during the same period. We now see that if temperature really exert any influence, that of the soil must be considered as well as that of the atmosphere above it; and is even, perhaps, in this case of more importance, as the course of the phenomena of soil-temperature in Decem- ber and January corresponds more closely with the course of the prevalence than that of the atmospheric-temperature does. (g) Carbonic acid of the Soil-air—Soil-ventilation- Table XXXYI.—Comparison of the monthly averages of Carbonic Acid [at 6 feet] with Cholera Prevalence. Relative amount of Co.2 in Soil-air November. December. January. February. March. April. May. June. July. August. September. October. November. 5 6 5 3 1 1 2 2 2 5 6 5 5 (Macpherson) ... 8323 8159 7150 9346 14710 19382 13335 6325 3979 3440 3935 6211 8323 O (Payne) 2789 2175 1955 3226 4848 4658 3306 2231 1318 1684 1543 18U5 2789 o Tutal 11)12 10334 9106 12572 19558 24040 10641 8556 6297 5124 6478 8016 11112 o The diagram in this case is constructed from confessedly veiy imperfect materials. Our data regarding the amount of carbonic Acid, m son-air. carbonic acid in the soil-air are as yet very limited, and those employed in the present instance are derived from observations carried out for little more than a year—from July 1873 to August 1874—after which date the observations were unavoidably interrupted until May 1877.* Certain facts have, however, been already ascertained regarding the course of the fluctuations in amount of carbonic acid in the soil-air, so that the data of * We are indebted to Mr. Henry F. Blanford, Meteorological Reporter to the Government of India, for having made arrangements for the exposure of tubes charged with baryta solution at certain of the larger Meteorological stations. The requisite apparatus has already been provided at Allahabad, Lucknow and Delhi, and observations are now conducted at these places through the assistance of Mr. S. A. Hill, B.Sc., Dr. Bonavia and Assistant-Surgeon Kadha Kishen. The tubes charged with the baryta solution are sent by post to the different stations at short intervals, returned after exposure, and the amount of carbonic acid determined.](https://iiif.wellcomecollection.org/image/b22322255_0046.jp2/full/800%2C/0/default.jpg)
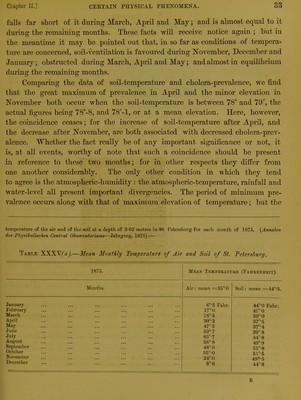
 No text description is available for this image
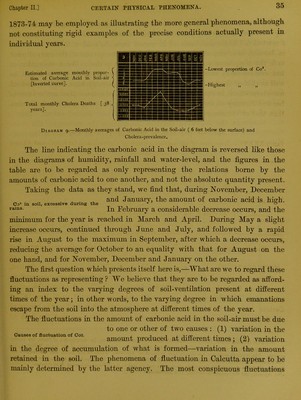
 No text description is available for this image
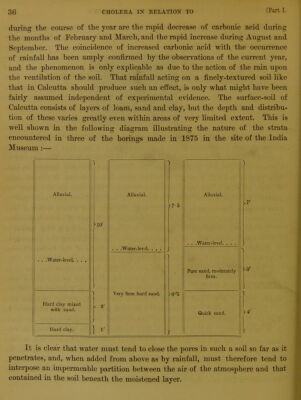
 No text description is available for this image