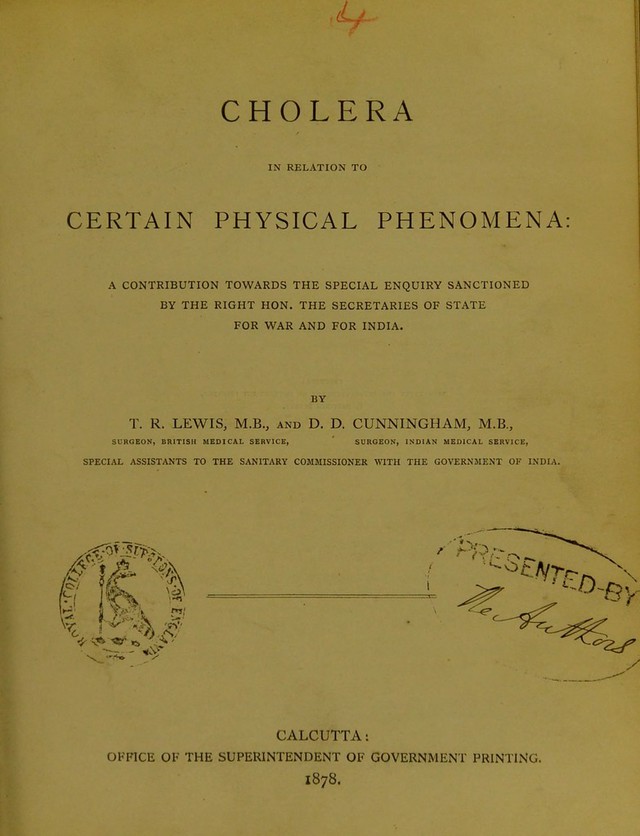
Cholera in relation to certain physical phenomena : a contribution towards the special enquiry sanctioned by the Right Hon. the Secretaries of State for War and for India / by T.R. Lewis and D.D. Cunningham.
- Timothy Richards Lewis
- Date:
- 1878
Licence: Public Domain Mark
Credit: Cholera in relation to certain physical phenomena : a contribution towards the special enquiry sanctioned by the Right Hon. the Secretaries of State for War and for India / by T.R. Lewis and D.D. Cunningham. Source: Wellcome Collection.
Provider: This material has been provided by The Royal College of Surgeons of England. The original may be consulted at The Royal College of Surgeons of England.
45/146 page 35
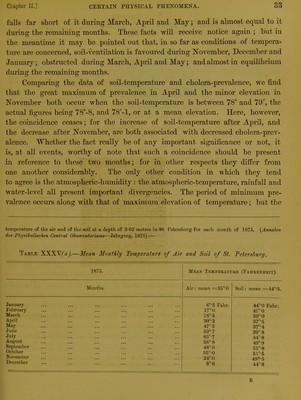
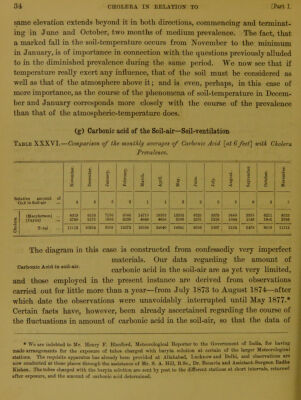
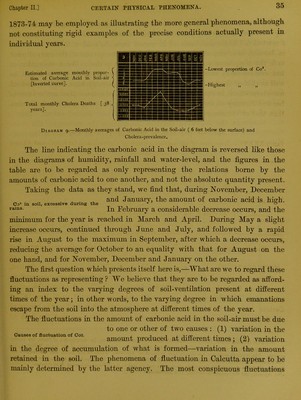
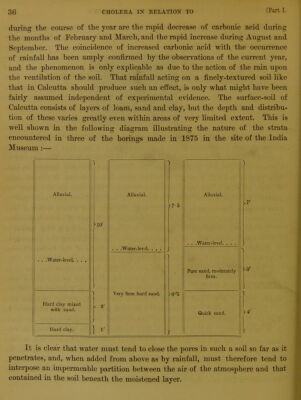
![1873-74 may be employed as illustrating the more general phenomena, although not constituting rigid examples of the precise conditions actually present in individual years. Estimated average monthly propor- tion of Carbonic Acid in Soil-air [Inverted curve]. Total monthly Cholera Deaths [ 38 years]. Diagram 9.—Monthly averages of Carbonic Acid in the Soil-air ( 6 feet below the surface) and Cholera-prevalence. The line indicating the carbonic acid in the diagram is reversed like those in the diagrams of humidity, rainfall and water-level, and the figures in the table are to be regarded as only representing the relations borne by the amounts of carbonic acid to one another, and not the absolute quantity present. Taking the data as they stand, we find that, during November, December . j ^ and January, the amount of carbonic acid is hierh. Co9 in soil, excessive during the * ° rains- In February a considerable decrease occurs, and the minimum for the year is reached in March and April. Diming May a slight increase occurs, continued through June and July, and followed by a rapid rise in August to the maximum in September, after which a decrease occurs, reducing the average for October to an equality with that for August on the one hand, and for November, December and January on the other. The first question which presents itself here is,—What are we to regard these fluctuations as representing ? We believe that they are to be regarded as afford- ing an index to the varying degrees of soil-ventilation present at different times of the year; in other words, to the varying degree in which emanations escape from the soil into the atmosphere at different times of the year. The fluctuations in the amount of carbonic acid in the soil-air must be due to one or other of two causes : (1) variation in the amount produced at different times; (2) variation in the degree of accumulation of what is formed—variation in the amount retained in the soil. The phenomena of fluctuation in Calcutta appear to be mainly determined by the latter agency. The most conspicuous fluctuations Causes of fluctuation of C02.](https://iiif.wellcomecollection.org/image/b22322255_0047.jp2/full/800%2C/0/default.jpg)
 No text description is available for this image
 No text description is available for this image
 No text description is available for this image