Cholera in relation to certain physical phenomena : a contribution towards the special enquiry sanctioned by the Right Hon. the Secretaries of State for War and for India / by T.R. Lewis and D.D. Cunningham.
- Timothy Richards Lewis
- Date:
- 1878
Licence: Public Domain Mark
Credit: Cholera in relation to certain physical phenomena : a contribution towards the special enquiry sanctioned by the Right Hon. the Secretaries of State for War and for India / by T.R. Lewis and D.D. Cunningham. Source: Wellcome Collection.
Provider: This material has been provided by The Royal College of Surgeons of England. The original may be consulted at The Royal College of Surgeons of England.
5/146
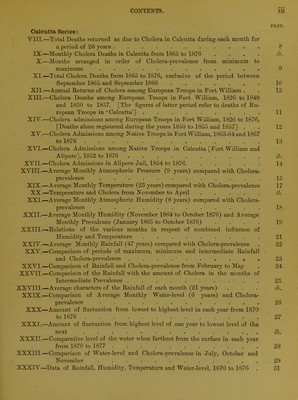
![Calcutta Series: VIII.—Total Deaths returned as due to Cholera in Calcutta during each month for a period of 26 years . IX.—Monthly Cholera Deaths in Calcutta from 1865 to 1876 .... X.—Months arranged in order of Cholera-prevalence from minimum to maximum ............. XI.—Total Cholera Deaths from 1865 to 1876, exclusive of the period between September 1865 and September 1866 . XII.—Annual Returns of Cholera among European Troops in Fort William . XIII. —Cholera Deaths among European Troops in Fort William, 1826 to 1849 and 1850 to 1857. [The figures of latter period refer to deaths of Eu- ropean Troops in ‘ Calcutta’] ......... XIV. —Cholera admissions among European Troops in Fort William, 1826 to 1876, [Deaths alone registered during the years 1850 to 1855 and 1857] . XV.—Cholera Admissions among Native Troops in Fort William, 1863-64 and 1867 to 1876 ............. XVI.—Cholera Admissions among Native Troops in Calcutta [Fort William and Alipore], 1852 to 1876 .......... XVII.—Cholera Admissions in Alipore Jail, 1854 to 1876. . XVIII.—Average Monthly Atmospheric Pressure (9 years) compared with Cholera- prevalence ............ XIX.—Average Monthly Temperature (23 years) compared with Cholera-prevalence XX.—Temperature and Cholera from November to April . . . . . XXI.—Average Monthly Atmospheric Humidity (8 years) compared with Cholera- prevalence ............ XXII.—Average Monthly Humidity (November 1864 to October 1876) and Average Monthly Prevalence (January 1865 to October 1876) . . . . XXIII.—Relations of the various months in respect of combined influence of Humidity and Temperature . . . ■ . . XXIV.—Average Monthly Rainfall (47 years) compared with Cholera-prevalence XXV.—Comparison of periods of maximum, minimum and intermediate Rainfall and Cholera-prevalence . . . . ' XXVI.—Comparison of Rainfall and Cholera-prevalence from February to May XXVII.—Comparison of the Rainfall with the amount of Cholera in the months of Intermediate Prevalence . . . . XXVIII.—Average characters of the Rainfall of each month (21 years) XXIX.—Comparison of Average Monthly Water-level (6 years) and Cholera- prevalence ............ XXX—Amount of fluctuation from lowest to highest level in each year from 1870 to 1876 XXXI.—Amount of fluctuation from highest level of one year to lowest level of the next .............. XXXII.—Comparative level of the water when farthest from the surface in each year from 1870 to 1877 ........... XXXIII.—Comparison of Water-level and Cholera-prevalence in July, October and November ............ XXXIV—Data of Rainfall, Humidity, Temperature and Water-level, 1870 to 1876 . «»• PAGE. 8 ib. 9 10 12 11 12 13 ib. 14 15 17 ib. 18 19 21 22 23 24 25 ib. 26 27 ib. 28 29 31](https://iiif.wellcomecollection.org/image/b22322255_0007.jp2/full/800%2C/0/default.jpg)