Fourteenth annual report of the registrar-general on the births, deaths, and marriages registered in Scotland during the year 1868; and fourth annual report on vaccination.
- Great Britain. General Register Office.
- Date:
- 1869
Licence: Public Domain Mark
Credit: Fourteenth annual report of the registrar-general on the births, deaths, and marriages registered in Scotland during the year 1868; and fourth annual report on vaccination. Source: Wellcome Collection.
Provider: This material has been provided by Royal College of Physicians, London. The original may be consulted at Royal College of Physicians, London.
24/48 (page 24)
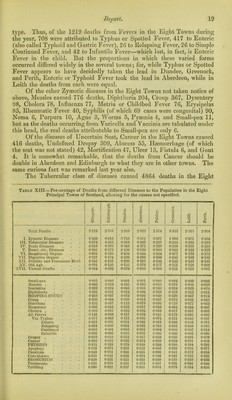
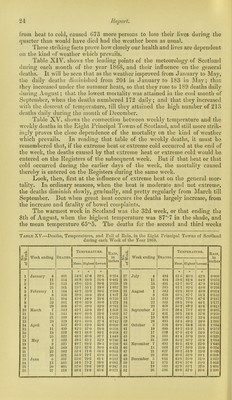
![from heat to cold, caused 673 more persons to lose their lives during the quarter than would have died had the weather been as usual. These striking facts prove how closely our health and lives are dependent on the kind of weather which prevails. Table XIV. shows the leading points of the meteorology of Scotland during each month of the year 1868, and their influence on the general deaths. It will be seen that as the weather improved from January to May, the daily deaths diminished from 204 in January to 183 in May; that they increased under the summer heats, so that they rose to 189 deaths daily during August; that the lowest mortality was attained in the cool month of September, when the deaths numbered 172 daily; and that they increased with the descent of temperature, till they attained the high number of 213 deaths daily during the month of December. Table XV. shows the connection between weekly temperature and the weekly deaths in the Eight Principal Towns of Scotland, and still more strik- ingly proves the close dependence of the mortality on the kind of weather which prevails. In reading that table of the weekly deaths, it must be remembered that, if the extreme heat or extreme cold occurred at the end of the week, the deaths caused by that extreme heat or extreme cold would be entered on the Registers of the subsequent week. But if that heat or that cold occurred during the earlier days of the week, the mortality caused thereby is entered on the Registers during the same week. Look, then, first at the influence of extreme heat on the general mor- tality. In ordinary seasons, when the heat is moderate and not extreme, the deaths diminish slowly, gradually, and pretty regularly from March till September. But when great heat occurs the deaths largely increase, from the increase and fatality of bowel complaints. The warmest week in Scotland was the 32d week, or that ending the 8th of August, when the highest temperature was 87°'7 in the shade, and the mean temperature 650,5. The deaths for the second and third weeks Table XV.—Deaths, Temperatures, and Fall of Rain, in the Eig-ht Principal Towns of Scotland during each Week of the Year 1868. 1 9 ro3 C 6 ° u-> o Week ending Deaths. ! Temperature. Rain, in inches No. of Week, j Week ending Deaths. Temperature. Rain, j iu j inches] Mean. Highest Lowest. Mean. Highest Lowest. i January 4 481 O 34-3 O 47 0 O 22-5 0-254 27 J uly 4 494 O Gl-G O 83-0 o 42-0 0-000; 2 ]1 554 368 480 2C'0 0-4S1 28 11 484 596 SI-8 44-9 0-070 3 18 553 43-0 55-5 30’S 2-333 29 18 491 617 85 7 47-9 0-152 4 25 561 35-7 55 1 18-0 1-892 30 25 585 61-1 82-6 43-0 0-236 5 February 1 544 43-2 55-0 30'6 2-3SS 31 August 1 5S2 C2-5 81-0 45-0 0-034 6 8 526 399 50 0 29-0 1 837 32 8 618 655 S7-7 51-3 0-552 7 15 504 43-4 54-9 25-6 0735 33 15 545 59-3 72-0 47-6 31S1 8 22 501 42-0 520 30-0 1-272 34 22 533 5S-5 76-0 44-1 1-177 9 29 568 47-0 59-0 32-0 0763 35 29 469 55’2 69-2 45-6 0-815 10 March 7 542 42 T 53-0 297 1-359 36 September 5 506 58 4 75-7 41-0 0-4031 11 14 543 44-0 co-o 310 1-002 37 12 431 5GT 84-3 37-0 0-2601 12 21 539 45-5 58-5 321 0725 38 19 496 50-0 617 32-4 0-602 13 28 529 42-5 60-0 27-4 0742 39 26 495 53-4 69-5 38-0 1-396 14 April 4 532 49-3 62-0 35-0 o-ooo 40 October 3 524 49-9 64-8 31-0 1-334 15 11 490 42-5 57'0 2S0 0-55S 41 10 4S0 49-2 61-2 35-1 0-572 16 18 552 481 680 30T 0-238 42 17 538 47-3 61-0 34-0 0-753 17 25 522 48T 60-0 37-7 1-649 43 24 503 41-4 57-0 28-0 0-929 18 May 2 522 48-5 652 32-9 07S6 44 31 560 45’2 60-2 31-8 1-014 19 9 523 487 6S-2 29-5 0-2S0 45 November 7 492 41-5 61-0 23-0 1-649 20 16 560 52-5 67'0 30-0 0-431 46 14 588 377 53-0 25-0 0334 21 23 502 53-4 710 34 3 0-955 47 21 627 3S-2 51-9 25-0 0-109 22 30 521 55-3 727 43-0 0-581 4S 28 609 40-6 53-0 301 0-388 23 June 6 507 55-0 70-3 411 0-212 49 December 5 614 43-5 55-0 31-0 1-332 24 13 505 54 8 75'2 38-0 0-081 50 12 575 42-6 57-0 25-0 1 553 25 20 485 57'0 79-6 39-2 0-247 51 19 5S3 429 57T 2d 0 1-606 26 27 518 58-4 74-8 45-6 0-371 52 26 596 40-0 57-0 30-6 1-590](https://iiif.wellcomecollection.org/image/b28040454_0026.jp2/full/800%2C/0/default.jpg)