Annual report of the Director of Public Health of the United Provinces of Agra and Oudh.
- United Provinces of Agra and Oudh (India). Public Health Department
- Date:
- [1940]
Licence: Public Domain Mark
Credit: Annual report of the Director of Public Health of the United Provinces of Agra and Oudh. Source: Wellcome Collection.
264/288 page 206
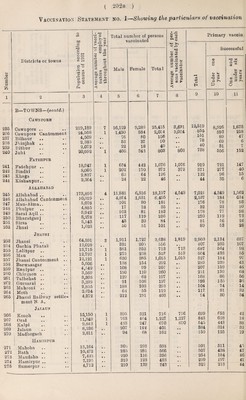
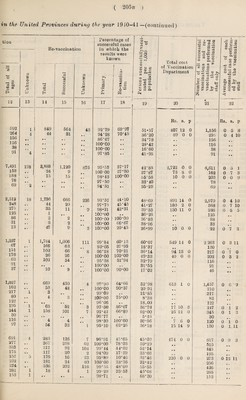
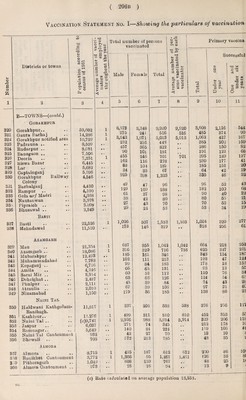
![Vaccination Statement no. I—Showing the particulars of vaccination Total number of persons vaccinated Male B—TOWNS—(oontd.) Gorakhpur 320 321 322 323 324 825 326 327 328 329 330 331 332 333 334 33j 336 837 338 Gorakhpur.. Gaura Barhaj Gorakhpur notified area Padrauna .. •• Rudarpur .. Bansgaon .. Deoria Siswa Bazar Lar Gaptainganj Gorakhpur Colony Barhalganj Rampur Gcla urf Madri Nautanwan Pipraich Bhusawal .. Bail way Basti 339 340 341 342 343 344 345 346 347 348 349 Basti • • Mehndawal Azamgarh 350 851 Mau Azamgarh .. Mubarakpur Muhammadabad Kopaganj .. Amila Sarai Mir .. Dohrighat .. Phulpur .. Atraulia Nizamabad Naini Tal Haldwani Katligodam- Ranibagh. Kashipur.. 352 Naioi Tal .. 353 Jaspur 354 Ramnagar.. 355 Naini Tal Cantoument 356 Bhowali Almora 357 Almora 358 Rauikhet Cantoument 3 ,9 ; Pithoragarh 360 Almora Cantonment .. 59,602 14,286 10,729 8,599 8,081 7,506 7,251 6,445 5,682 5,596 4,546 4,430 4,100 4,038 3,978 3.098 2,349 22,526 11,510 21,354 18,046 12,493 7,783 6,716 4,246 3,354 2,487 2,111 2,010 1,150 11,817 11.276 (c)9,741 6,037 5,649 1 1 1 1 1 982 705 8,715 3,772 1,049 973 Female • JA u o O Ci & <a Total 6 S+-I ^ o t} W CD <1) >3 rO <3 a.s - s o o a o ea £ ^ £3 © ^ .1-1 oo C2 o C3 d o M o ^ CO t* Primary vaccina Successful <u > <1 8 c3 ■+3 o CD S3 O SJ J-j a; a) a P <Tj t*1 c ce U1 10 SJ a» S§ o CO l-l o3 <D 11 6,572 3,348 9,920 9,920 3,608 2,116 5 275 241 516 516 485 374 l 3,942 1,071 5,013 5,013 1,063 427 1 232 216 443 • * 385 202 1 457 365 822 • • 286 150 90 101 191 • • 191 122 455 246 701 701 395 189 1 162 116 278 • • 230 177 83 104 187 185 151 34 33 67 1 64 42 925 V 398 . 1,323 • • 335 46 49 47 96 96 52 129 109 238 • • 182 100 61 37 98 * « 90 40 38 42 80 • • 80 55 27 43 70 70 53 29 24 53 53 34 1,026 507 1,533 1,533 1,004 320 2 173 146 319 • • 318 256 687 355 1,042 1,042 664 218 2 396 320 716 716 625 347 2 185 161 346 • • 343 154 1 102 111 213 • • 193 47 1 99 84 183 • • 178 18 1 66 65 131 • • 93 13 60 52 112 110 76 63 63 126 124 54 45 39 84 74 43 67 39 106 97 21 129 56 185 • « 138 86 337 201 538 538 376 256 ] 499 311 810 810 452 353 2,926 988 3,914 3,914 329 206 1 271 74 345 1 212 178 140 84 224 159 106 43 27 70 18 10 572 213 785 • • 48 35 425 187 612 612 200 86 1,366 95 1,461 1,451 126 38 608 159 767 • » 48 25 78 16 94 • • 13 I 9 90 82 68 41 20 19 32 43 68 22 21 15 19 61 55 34 6c 28 4C 21 117 55 1C U 10! 81 1< (c) Rate calculated on average population 13,558,](https://iiif.wellcomecollection.org/image/b31405034_0264.jp2/full/800%2C/0/default.jpg)