Annual report of the Director of Public Health of the United Provinces of Agra and Oudh.
- United Provinces of Agra and Oudh (India). Public Health Department
- Date:
- [1940]
Licence: Public Domain Mark
Credit: Annual report of the Director of Public Health of the United Provinces of Agra and Oudh. Source: Wellcome Collection.
267/288 page 209
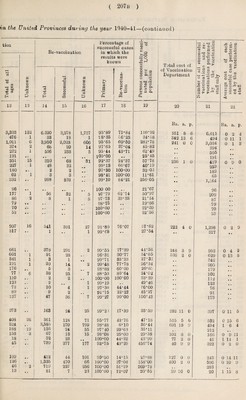
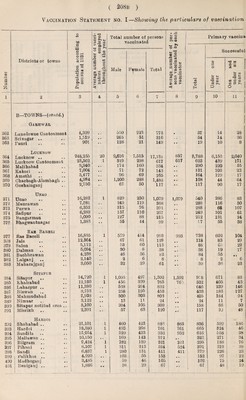
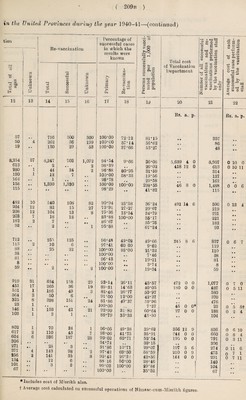
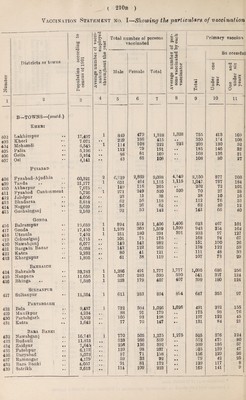
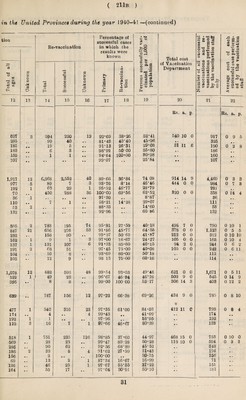
![in the United Provinces during the year 1940-41—(continued) tion Re-vaccination 1 Percentage of successful cases in which the results were known Persons successfully vacci¬ nated per 1,000 of population Total cost of Vaccination Department successful and re- performed lation staff ) Unknown ] I Total of all ages Total Successful Unknown | Primary Re-vaccina¬ tion Number of all vaccinations vaccinations by the vaccii only 12 13 14 15 16 17 18 19 20 21 Rs. a. P- 57 • • 716 300 300 100-00 72-12 81* *15 357 50 4 262 36 199 100*00 57*14 56*62 86 19 • • 130 29 53 100*00 37*66 53*27 • • 48 8,254 57 8,347 703 1,072 94-54 9-66 36-08 5,639 4 0 8,957 613 • • 2 o • 2 98-39 • • 26-02 418 12 0 613 280 1 44 34 2 96*88 80-95 31-59 314 130 1 12 7 • • 100*00 58-33 19*56 137 162 • • 1 • • • • 98*78 • • 29*58 162 156 •• 1,330 1,330 • • 100*00 100*00 298*55 46 8 0 1,488 115 • • • • • • • • 98*29 • • 41*82 • • 115 482 10 540 108 82 90-94 23*58 36*24 492 14 6 590 204 12 82 15 27 73-91 27-27 29*67 219 208 12 104 13 8 75*36 13-54 34*79 221 203 7 18 18 • • 83-88 100-00 35*17 221 182 2 7 • • • • 86-67 • • 35-76 • • 182 93 • • 2 • • 1 95-88 « • 67*24 • • 93 712 • • 255 125 • * 96-48 49-02 49-66 345 8 6 837 113 2 10 6 • • 97-41 60 00 9-62 119 88 25 22 • • 100-00 88*00 21-52 110 38 • • • « • • 100-00 • • 7-46 38 81 • • • • • • 96*43 • ♦ 19*11 81 8 • • • • • • 100*00 f • 3-74 8 59 2 • • 2 100*00 • • 19*34 • • 59 919 31 634 158 29 93-14 26-11 43*57 472 0 0 1,077 451 17 265 36 19 89-31 14-63 40-05 180 0 0 487 531 1 186 49 3 82-46 26*77 50*97 580 364 3 50 6 « • 91-00 12-00 42-27 370 325 8 398 151 24 81-86 40*37 59*96 • • 476 23 1 • • • • • • 100*00 7*37 45 0 0* 23 146 1 153 42 21 92-99 31-82 60*64 27 0 0 188 103 1 3 1 • • 88-79 33-33 43*50 * • 104 802 1 70 34 1 96-05 49-28 39*62 356 12 9 836 617 2 110 43 7 93-06 41-75 35*91 344 0 0 660 604 6 386 187 28 99-02 60*71 52*54 195 0 0 791 306 • • • • • « • • 94-74 • • 30*15 • • 306 271 • t 28 8 • • 91*86 10*71 29°07 197 5 6 274 377 4 143 98 2 97-42 69-50 58-59 210 0 9 475 256 2 141 35 8 92-42 26-32 42*56 144 0 134 c • 12 6 • • 88 16 50-00 28-46 140 101 • • 3 3 • • 99-02 100*00 29*84 104 67 • • • • * • • • 100-00 • • 35*52 • • 67 #Includes cost of Misrikh also. f Average cost calculated on successful operations of Nimsar-cum-Misrikh figures. xi l a o a o C« S-) • <D O •4—< cd 5-1 P <T) *r-4 o o - > m W O o o <D J3 <D 55 £§• 5 3> f> 0Q 22 Rs. a. p. 0 10 0 0 10 11 • • • • 0 *6 6 • • 0 13 4 • • 0 6 7 0 7 0 0 5 11 0 *5 8f 0 2 4 0 6 10 0 8 4 0 3 11 o ii 6 0 7 1](https://iiif.wellcomecollection.org/image/b31405034_0267.jp2/full/800%2C/0/default.jpg)