Annual report of the General Board of Commissioners in Lunacy for Scotland : 42nd 1900
- Great Britain. General Board of Commissioners in Lunacy for Scotland.
- Date:
- 1900
Licence: Public Domain Mark
Credit: Annual report of the General Board of Commissioners in Lunacy for Scotland : 42nd 1900. Source: Wellcome Collection.
65/260
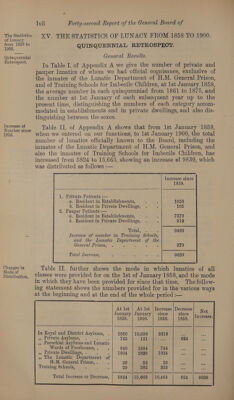
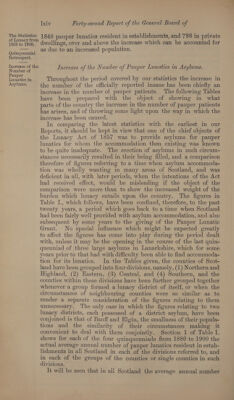
![These figures show an increase under every head except private The Statistics : : : of Lunacy from asylums, which have long ceased to receive pauper patients and 1858 to 1900. are now few in number, Since 1858, the number of lunatics under Oninqalenel the jurisdiction of the Board has increased 169 per cent. The Retrosteel | increase of the population during the same period has been 41 per cent. Table IIT. of Appendix A shows that at 1st January 1900 the Proporta proportion of private lunatics in establishments was 48 per 100,000 Perna of population, which is the same as at Ist January of the previous year. The proportion of pauper lunatics in establishments per 100,000 of population was at the beginning of this year 241, which is three above the number at the beginning of last year, and 1s the highest figure yet recorded. The proportion of pauper lunatics in private dwellings per 100,000 of population was at the beginning of this year 63, which is the same as last year. The proportion of all pauper lunatics per 100,000 of population shows an almost steady increase since 1858, and at the beginning of this year attained its highest figure of 304, as against the next highest, 301, which was attained last year. The following tabular statement shows for each quinquennial period from 1880 to 1899 the average annual number of private and of pauper patients resident in establishments and in private dwellings, in proportion to population :— | | Proportions per 100,000 of Population of e Private Lunatics Pauper Lunatics ipl an 3 Resident in Resident in Re d hap esk a esident 1n =| 5 a ; os = S | ee | 8fP la) Be) 82 |s| Be | SP le & | 28 | 3/8] 88 | 23 |o| 48 | BS | = Bale eee EI ap Ste ie eo et bos eeegge:) | oat Bit) Ee eS A <3) A ie Q 1880-84 38 3 41 187 45 232 225 48 26S 1885-89 40 3 43 192 58 250 232. 61 293 1890-94 | 43 3 46 208 63 OTT 251 66 317 1895-99 47 3 50 Qo 1 64 | 295 278 67 345 It will be seen from this statement that the number of private patients resident in establishments has increased by nine per 100,000 of population during the period dealt with. Taking the population as 4,200,000 at the end of the period, this represents an increase of 378 beyond what can be accounted for by increase of population. The proportion of private patients provided for in private dwellings has remained unchanged throughout the period. In the case of pauper patients the increase has been 44 per 100,000 in establish- ments, and 19 in private dwellings, which represents an increase of](https://iiif.wellcomecollection.org/image/b31856573_0065.jp2/full/800%2C/0/default.jpg)