Annual report on the health and medical services of the state of Queensland.
- Queensland. Department of Health.
- Date:
- [1948]
Licence: Public Domain Mark
Credit: Annual report on the health and medical services of the state of Queensland. Source: Wellcome Collection.
98/108 (page 96)
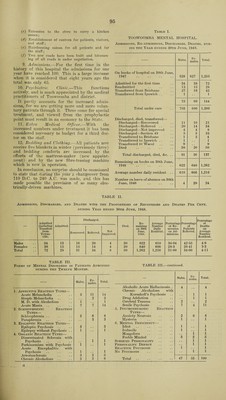
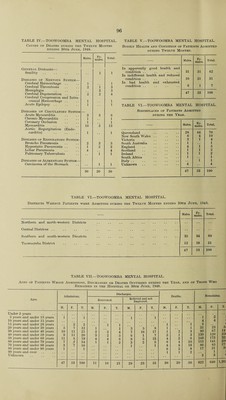
![TABLE IV.—TOOWOOMBA MENTAL HOSPITAL. Causes of Deaths during the Twelve Months ending 30th June, 1948. Males. Fe¬ males. Total. General Diseases— Senility 1 1 Diseases of Nervous System— Cerebral Hsemorrhage 1 1 Cerebral Thrombosis 2 i 3 Hemiplegia 3 3 Cerebral Degeneration . . 2 2 4 Cerebral Compression and Intra- cranial Hiemorrhage . . 1 , . 1 Acute Epilepsy . . 1 1 Diseases of Circulatory System Acute Myocarditis 3 3 6 Chronic Myocarditis 1 1 Coronary Occlusion 1 # , 1 Myocarditis 10 3 13 Aortic Regurgitation (Endo- carditis) 1 I Diseases of Respiratory System- Broncho Pneumonia 2 3 5 Hypostatic Pneumonia . . 1 2 3 Lobar Pneumonia 4 4 Pulmonary Tuberculosis i 1 Diseases of Alimentary System— Carcinoma of the Stomach l 1 30 20 50 TABLE V.—TOOWOOMBA MENTAL HOSPITAL. Bodily Health and Condition of Patients Admitted during Twelve Months. Males. Fe¬ males. Total. In apparently good health and condition . . 31 31 62 In indifferent health and reduced condition . . 10 21 31 In bad health and exhausted condition .. 6 1 7 47 53 100 TABLE VI.—TOOWOOMBA MENTAL HOSPITAL. Birthplaces of Patients Admitted DURING THE YEAR. Males. Fe¬ males. Total. Queensland . . 26 44 70 New South Wales .. 6 4 10 Victoria 3 1 4 South Australia 1 . . 1 England 4 1 5 Scotland 1 1 2 Ireland 1 1 2 South Africa 1 • . 1 Italy .. • • 1 1 Unknown 4 • • 4 47 53 100 TABLE VI.—TOOWOOMBA MENTAL HOSPITAL. Districts Whence Patients were Admitted during the Twelve Months ending 30th June, 1948. Males. Fe¬ males. Total. Northern and north-western Districts Central Districts . . Southern and south-western Districts 35 34 69 Toowoomba District 12 19 31 i . v * T 47 53 100 TABLE VII.—TOOWOOMBA MENTAL HOSPITAL. Ages of Patients Whose Admissions, Discharges or Deaths Occurred during the Year, and of Those Who Remained in the Hospital on 30th June, 1948. Ages. Admissions. Discharges. Deaths. Remaining. Recovered. Relieved and not Improved. M. F. T. M. F. T. M. F. T. M. F. T. M. F. T. Under 5 years , , . . . • 5 years and imder 10 years 1 , , 1 1 1 , , . . 1 2 10 years and under 15 years . . , , # . . . 4 4 15 years and under 20 years 2 2 1 1 1 1 6 • • 20 years and under 30 years 5 7 12 1 1 3 5 8 1 1 31 23 30 years and under 40 years 10 11 21 2 2 4 7 10 17 1 2 3 80 67 14 40 years and imder 50 years 9 11 20 3 2 5 6 1 7 2 1 3 130 120 25( 50 years and under 60 years 11 8 19 4 4 8 8 5 13 4 2 6 149 173 32: 60 years and under 70 years 7 7 14 1 1 2 3 2 5 6 4 10 115 141 25< 70 years and under 80 years 3 7 10 1 1 8 8 16 86 85 171 80 years and under 90 years 1 1 6 2 8 17 21 3£ 90 years and over 1 1 2 1 ] Unknown *» 3 3 ( 47 53 100 11 10 21 29 23 52 30 20 50 622 640 i,26;](https://iiif.wellcomecollection.org/image/b31494109_0098.jp2/full/800%2C/0/default.jpg)