[Report 1969] / Medical Officer of Health, Harrogate Borough.
- Harrogate (England). Borough Council. nb2014025795.
- Date:
- 1969
Licence: Attribution 4.0 International (CC BY 4.0)
Credit: [Report 1969] / Medical Officer of Health, Harrogate Borough. Source: Wellcome Collection.
15/108 (page 13)
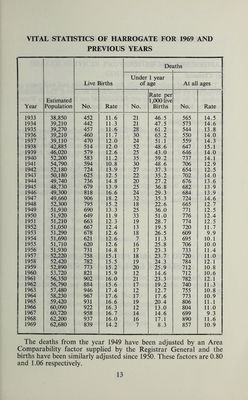
![VITAL STATISTICS OF HARROGATE FOR 1969 AND PREVIOUS YEARS Year Estimated Population Dei iths Live ] iirths Under 1 year of age At all ages No. Rate No. Rate per 1,000 live Births No. Rate 1933 38,850 452 11.6 21 46.5 565 14.5 1934 39,210 442 11.3 21 47.5 573 14.6 1935 39,270 457 11.6 28 61.2 544 13.8 1936 39,210 460 11.7 30 65 2 550 14.0 1937 39,110 470 12.0 24 51.1 559 14.3 1938 42,885 514 12.0 52 48.6 647 15.1 1939 46,020 579 12.6 25 43.0 646 14.0 1940 52,200 583 11.2 35 59.2 737 14.1 1941 54,790 594 10.8 30 48.6 706 12.9 1942 52,180 724 13.9 27 37.3 654 12.5 1943 50,180 625 12.5 22 35.2 702 14,0 1944 49,740 736 14.8 20 27.2 676 13.6 1945 48,730 679 13.9 25 36.8 682 13.9 1946 49,300 818 16.6 24 29.3 684 13.9 1947 49,660 906 18.2 32 35.3 724 14.6 1948 52,300 795 15.2 18 22.6 665 12.7 1949 51,930 690 13.3 25 36.0 771 12.5 1950 51,920 649 11.9 33 51.0 776 12.4 1951 51,210 663 12.3 19 28.7 774 12.5 1952 51,050 667 12.4 13 19.5 720 11.7 1953 51,290 678 12.6 18 26.5 609 9.9 1954 51,690 621 12.6 7 11.3 695 10.1 1955 51,710 620 12.6 16 25.8 706 10.0 1956 51,930 731 14.8 17 23.3 733 11.4 1957 52,220 758 15.1 18 23.7 720 11.0 1958 52,420 782 15.5 19 24.3 784 12.1 1959 52,890 773 15.2 20 25.9 712 10.8 1960 53,720 821 15.9 12 14.6 712 10.6 1961 56,350 902 16.0 21 23.3 782 12.1 1962 56,790 884 15.6 17 19.2 740 11.3 1963 57,480 946 17.4 12 12.7 755 10.8 1964 58,230 967 17.6 17 17.6 773 10.9 1965 59,420 931 16.6 19 20.4 806 11.1 1966 60,090 922 16.3 12 13.0 804 11.0 1967 60,720 958 16.7 14 14.6 699 9.3 1968 62,200 937 16.0 16 17.1 890 11.6 1969 62,680 839 14.2 7 8.3 857 10.9 The deaths from the year 1949 have been adjusted by an Area Comparability factor supplied by the Registrar General and the births have been similarly adjusted since 1950. These factors are 0.80 and 1.06 respectively.](https://iiif.wellcomecollection.org/image/b29411464_0015.jp2/full/800%2C/0/default.jpg)