[Report 1942] / Medical Officer of Health, Royal Tunbridge Wells Borough.
- Tunbridge Wells (England). Borough Council.
- Date:
- 1942
Licence: Attribution 4.0 International (CC BY 4.0)
Credit: [Report 1942] / Medical Officer of Health, Royal Tunbridge Wells Borough. Source: Wellcome Collection.
4/16 (page 3)
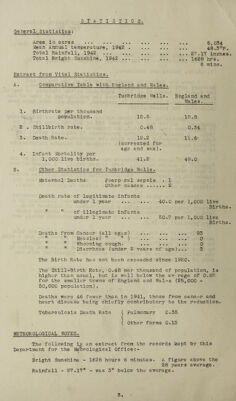
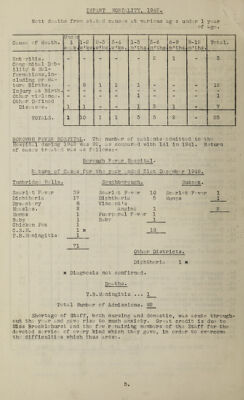
![ST ATI STIC S. General Statistics; Area in acres . Mean Annual temperature, 1942 . Total Rainfall, 1942 . Total Bright Sunshine, 1942 ... . • • 6,034 ... 48.3°p. ... 27.17 Inches . ... 1628 hrs. 6 mins. Extract from Vital Statistics. A. Comparative Table with England and Wales. Tunbridge Wells. 1. Birthrate per thousand population. 2 . Stillbirth rate. 3. Death Rate. Infant Mortality per 1,000 live births. B. 15.5 0.48 12.2 (corrected for age and sex). 41.2 England and Wales. 15.8 0.54 11.6' 49.0 Other Statistics for Tunbridge Wells. Maternal Deaths Puerp-ral sepsis . 1 Other causes . 2 Death rate of legitimate infants under 1 year ” of illegimate infants under 1 year ... 40.0 per 1,000 live Births. 50.7 per 1,000 live Births. Deaths from Cancer (all ages) ... ... ... 93 Measles( ” ) ... ... ... 0 ’’ Whooping cough. . 0 ’* Diarrhoea (under 2 rears of age)... 3 The Birth Rate has not been exceeded since 1920. The Still-Birth Rate, 0.48 per thousand of population, is higher than usual, but is well below the av-rage of 0.62 for the smaller towns of England and Wales (25,000 - 50,000 population). Deaths were 46 fev\^er than in 1941, those from cancer and heart disease being chiefly contributory to the reduction. Tuberculosis Death Rate ( Pulmonary 0.35 ( , ' ( Other forms 0.13 METEOROLOGICAL NOTES. The following ±3 an extract from the records kept by this Department for the ]\fe'’orological Office Bright Sunshine - 1628 hours 6 minutes. A figure above the 28 years average. Rainfall - 27.17” - was 3 belov; the average.](https://iiif.wellcomecollection.org/image/b30196462_0004.jp2/full/800%2C/0/default.jpg)