Estuary of the River Mersey : The effect of the discharge of crude sewage into the estuary of the River Mersey on the amount and hardness of the deposit in the estuary.
- Great Britain. Water Pollution Research Board
- Date:
- 1938
Licence: Public Domain Mark
Credit: Estuary of the River Mersey : The effect of the discharge of crude sewage into the estuary of the River Mersey on the amount and hardness of the deposit in the estuary. Source: Wellcome Collection.
69/386 page 41
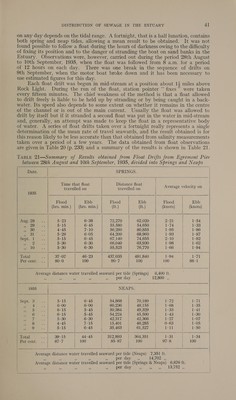
![on any day depends on the tidal range. A fortnight, that is a half lunation, contains both spring and neap tides, allowing a mean result to be obtained. It was not found possible to follow a float during the hours of darkness owing to the difficulty of fixing its position and to the danger of stranding the boat on sand banks in the Estuary. Observations were, however, carried out during the period 28th August to 10th September, 1935, when the float was followed from 8 a.m. for a period of 12 hours on each day. There was one break in the sequence of drifts on 9th September, when the motor boat broke down and it has been necessary to use estimated figures for this day. Each float drift was begun in mid-stream at a position about 14 miles above Rock Light. During the run of the float, station pointer “ fixes’’ were taken every fifteen minutes. The chief weakness of the method is that a float allowed to drift freely is liable to be held up by stranding or by being caught in a back- water. Its speed also depends to some extent on whether it remains in the centre of the channel or is out of the main current. Usually the float was allowed to drift by itself but if it stranded a second float was put in the water in mid-stream and, generally, an attempt was made to keep the float in a representative body of water. A series of float drifts taken over a fortnight really represents a single determination of the mean rate of travel seawards, and the result obtained is for this reason likely to be less accurate than that obtained from salinity measurements taken over a period of a few years. The data obtained from float observations are given in Table 20 (p. 233) and a summary of the results is shown in Table 21. TABLE 21—Summary of Results obtained from Float Drifts from Egremont Pier between 28th August and 10th September, 1935, divided into Springs and Neaps Date. SPRINGS. | Time that float Distance float ey Saat | travelled on travelled on BE SIL 1935 Flood Ebb Flood Ebb Flood Ebb (hrs. min.) | (hrs. min.) (ft.) (ft.) (knots) (knots) Aug. 28 5°23 6-38 72,270 62,020 272) 1-54 iy 29 5°15 6-45 55,580 54,650 1-74 1-33 ae 4-45 7:10 56,280 80,855 1-95 1-86 Bol 5°29 6-05 64,200 68,960 1-93 1-87 Sept. 1 5:15 6-45 67,140 74,655 2-10 1-82 i ie: 5-30 6-30 66,040 63,930 1-98 1-62 5 10 5:30 6-30 55,525 76,770 1-66 1-94 Total 37-07 46-23 437,035 481,840 1-94 1-71 Per cent. 80-0 100 90-7 100 100 88-1 Average distance water travelled seaward per tide (Springs) 6,400 ft. ” ” ” ” ” per day ” 12,800 ” 1935 | NEAPS. : | ent. 3 | 5°15 6-45 54,868 70,189 1°72 1-71 OS = ae 6-00 6-00 60,236 49,155 1-68 1:35 a. 3 . 6-15 5°45 50,384 49,329 1-33 1-4] i ae 6°15 5:45 54,224 45,500 1-43 1-30 or, 5-30 6-30 42,317 | 42,366 1-27 1-07 = 8 4-45 7°15 15,401 | 46,285 0:63 | 1-05 ee 5:15 6:45 35,463. {| 61,527 i> 1 | 1-50 Total pre 39°15 | 44-45 | $12,893 | 364,351 1:31 | 1-34 Per cent. | ae ie 100 85-87 100 97-8 | 100 Average distance water travelled seaward per tide (Neaps) 7,351 ft. o z de § DODO 14,702 ,, Average distance water travelled seaward per tide (Springs & Neaps) 6,876 ft. ‘: bs i 3 ee per Caves. Pecos sf](https://iiif.wellcomecollection.org/image/b32171869_0069.jp2/full/800%2C/0/default.jpg)