Annual report of the Director of Public Health of the United Provinces of Agra and Oudh.
- United Provinces of Agra and Oudh (India). Public Health Department.
- Date:
- [1938]
Licence: Public Domain Mark
Credit: Annual report of the Director of Public Health of the United Provinces of Agra and Oudh. Source: Wellcome Collection.
25/430 (page 7)
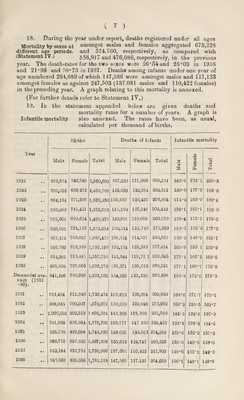
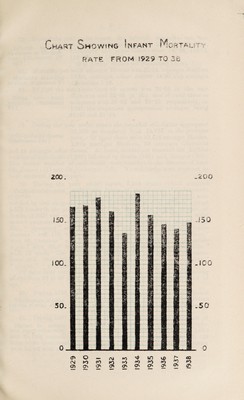
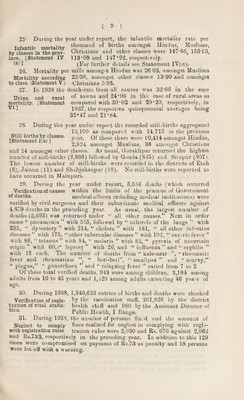
![/ 18, During the year under report, deaths registered under all ages Mortality by sexes at amongst males and females aggregated 675,228 different age periods, and 574,760, respectively, as compared with (Statement IV.) 558,917 and 476,086, respectively, in the previous year. The death-rates for the two sexes were 26 *54 and 25*03 in 1938 and 21*96 and 20*73 in 1937. Deaths among infants under one year of age numbered 264,689 of which 147,566 were amongst males and 117,123 amongst females as against 247*503 (137,081 males and 110,422 females) in the preceding year. A graph relating to this mortality is annexed. (For further details refer to Statement 1Y.) 19. In the statement appended below are given deaths and mortality rates for a number of years. A graph is Infantile mortality. also annexed. The rates have been, as usual, calculated per thousand of births. Births Deaths of infants Infantile mortality Year Male [ Female Total Male Female Total Male Female Total 1921 • • 819,854 740,748 1,560,602 197,223 171,908 369,131 240*6 232*1 236*5 1922 • • 769,516 690,272 1,459,788 145,928 122,384 268,312 189*6 177*3 183*8 1923 • * 864,154 771,296 1,635,450 150,567 126,427 276,994 174*2 163*9 169*4 1924 • • , 833,889 741,421 1,575,310 145,194 137,248 302,412 198*1 185*1 192*0 1925 • • 785,661 699,614 1,485/275 140,991 119,688 260,679 179*4 171*1 175*5 1926 • • 820,921 731,133 1.552,054 150,514 124,746 275,260 183*3 170 * 6 177*3 1927 * • 881,412 785,067 1,665,479 138,328 114,557 252,885 156*9 145*9 151*7 1928 • • 916,760 818,399 1,735,159 152,134 125,320 277,454 165*9 1531 159-9 1929 • • 824,281 733,445 1,557,726 142,944 119,70 1 262,645 173*4 163*2 168*6 1930 • • 895,508 797,665 1,693,173 158,571 130,610 289,181 177*1 163*7 170*8 Decennial ave¬ rage (1921 -30). 841,196 750,906 1,592,102 154,239 129,259 283,498 183*8 172*6 178-5 1931 • « 911,494 811,940 1,723,434 169,216 139,394 308,610 185*6 171*7 179*1 1932 • • 888,045 790,027 1,678,072 150,219 122,843 273,062 169*2 155*5 162*7 1933 • t 1,005,021 892,513 1.898,534 143,385 118,395 261,780 142*5 132*6 137*9 1934 • • 941,838 836,954 1,778,792 180,777 147 658 328,433 192*1 176*2 184-6 1935 • • 925,738 319,098 1,744,336 149,626 124,663 274,289 161*6 152*2 157*2 1936 • • 999,775 887,823 1,887,598 155,612 124,747 280,359 155*6 140*5 148*5 1937 • % 922,184 816,722 1,738,906 .137,081 110,422 247,503 148*6 135*2 142*3 • • 836,050 1,781,118] 147,566 117,123 264,689 156*1 140*1 - 148*6](https://iiif.wellcomecollection.org/image/b31405010_0025.jp2/full/800%2C/0/default.jpg)