[Report 1956] / Medical Officer of Health, Ince-in-Makerfield U.D.C.
- Ince-in-Makerfield (England). Urban District Council.
- Date:
- 1956
Licence: Attribution 4.0 International (CC BY 4.0)
Credit: [Report 1956] / Medical Officer of Health, Ince-in-Makerfield U.D.C. Source: Wellcome Collection.
8/32 page 6
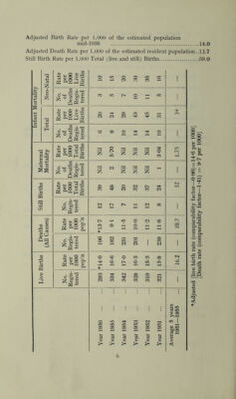
![Adjusted Birth Rate per 1,000 of the estimated population mid-1956 14.0 Adjusted Death Rate per 1,000 of the estimated resident population.. 13.7 Still Birth Rate per 1,000 Total (live and still) Births 39.0 Infant Mortality Neo-Natal Rate per 1000 Live Births 10 15 20 30 35 16 i ! No. of Deaths Regis- tered 3 5 7 10 11 5 i Total Rate per 1000 Live Births i 20 24 29 43 45 31 co No. of Deaths Regis- tered CD 00 O tT O r-H r-H r—^ 1 Maternal Mortality Rate per 1000 Total Births Nil 5-70 Nil Nil Nil 3-04 U~> o* No. of Deaths Regis- tered Nil 2 Nil Nil Nil 1 1 Still Births Rate per 1000 Total Births 39 | 48 20 32 37 24 (VI m 1 No. Regis- tered 2 £ ^ ^ 2 00 Deaths (All Causes) Rate per 1000 pop’n *13-7 91 11-5 10-0 11-2 11*8 d No. Regis- tered 196 182 231 201 239 i Live Births Rate per 1000 pop’n *14-0 16-6 170 16*3 15-3 15-8 l 16.2 | i No. Regis- tered 293 334 342 328 310 321 i Year 1956 Year 1955 Year 1954 Yean 1953 Year 1952 Year 1951 Average 5 years 1951—1955 ♦Adjusted [live birth rate (comparability factor—0*96) = 14-6 per 1000] [Death rate (comparability factor—1-41) =9*7 per 1000]](https://iiif.wellcomecollection.org/image/b29495489_0008.jp2/full/800%2C/0/default.jpg)