Report to the Local Government Board by Dr. G.W. Monier-Williams on the freezing point of milk considered in relation to the detection of added water.
- Gordon Wickham Monier-Williams
- Date:
- 1914
Licence: Public Domain Mark
Credit: Report to the Local Government Board by Dr. G.W. Monier-Williams on the freezing point of milk considered in relation to the detection of added water. Source: Wellcome Collection.
32/38 page 28
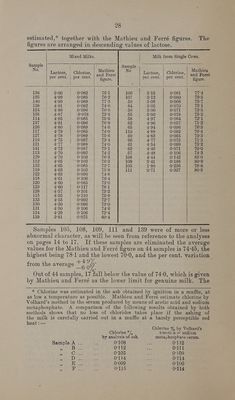
![estimated,* together with the Mathieu and Ferré figures. The figures are arranged in descending values of lactose. Mixed Milks. | Milk from Single Cows. en Pie | 4 ‘ Sample ; a Lactose, Chlorine, se 3h Lactose, | Chlorine, sen per cent, | per cent. fectices per cent. | per cent. figure. | : | | 136 500 -0082—«| 751 106 515 0-081 14 125 4:99 0°085 ae Pe 107 tee ne ba 140 4°99 0089 a 59 5:0 ; 138 4°91 - 0°082 74°6 64 5°05 0°070 73°1 124 4°88 0096 76°6 56 5°00 0°071 713°5 135 BOT be HO OTS 73°6 55 5°00 0°078 15°2 114 | 4°85 - 0°085 15°6 58 | 4:97 0°064 72:1 137 4°81 0°096 76°9 62 | 4:96 0°057 71:2 126 4°80 | 0:089 74:6 65) 4:94 07096 | 65 Tl] eaireea9 0°085 74:0 110 4:88 se ibe 127 4-78 ' 0°089 75°6 60 4°83 0°0 70° 116 2°75 Ba OO, 73°4 66 4°77 0°075 713 121 a°T7 « 34+ 0°088 74:0 61 4°54 0°099 13°22 141 4°72 0°087 73°1 63 *| 4°48 0'071 70°0 113 4°70 0:092 74:2 57. §|. 4°48 0°106 T4°3 129.1) eid? 70 0°103 763 108 | 4°44 0°142 83°0 gto ae 84205 0°103 76°3 109 3°41 0°188 80°6 132. | 4°65 0°085 12:7 105 1°80 0°236 78°6 io ae ee ee 111 0°71 0°337 80°8 118 4°61 0°106 76°4 120 4°60 0°085 72°0 | 123 4:60 O°117 781 = 128 4°57 0°101 75°2 | 115 4°55 0°110 75'9 133 4°55 0°092 72°7 / 130 4°50 0°096 73°0 131 4°50 0°106 74°6 | 134 4°29 0°106 72°4 139 3°81 0°075 60°4 Samples 105, 108, 109, 111 and 189 were of more or less abnormal character, as will be seen from reference to the analyses on pages 14 to 17. If these samples are eliminated the average values for the Mathieu and Ferré figure on 44 samples is 74-45, the highest being 78-1 and the lowest 70-0, and the per cent. variation +497. ? é —6 07. 3 Out of 44 samples, 17 fall below the value of 74-0, which is given by Mathieu and Ferré as the lower limit for genuine milk. The from the average * Chlorine was estimated in the ash obtained by ignition in a muffle, at as low a temperature as possible. Mathieu and Ferré estimate chlorine by Volhard’s method in the serum produced by means of acetic acid and sodium metaphosphate. A comparison of the following results obtained by both methods shows that no loss of chlorides takes place if the ashing of the milk is carefully carried out in a muffle at a barely perceptible red heat :— Chlorine % by Volhard’s Chlorine °/, titraticn o* sodium by analysis of ash. metaphosphate serum. Sample A ... 0°108 ik 07112 + Bra 0112 es O:111 C3 OF. 0105 a 0:109 os ERPs O'114 ee 0114 as Ea. 0:099 Be (100 Ses 0-115 a8 0114](https://iiif.wellcomecollection.org/image/b33474813_0032.jp2/full/800%2C/0/default.jpg)
 No text description is available for this image
 No text description is available for this image
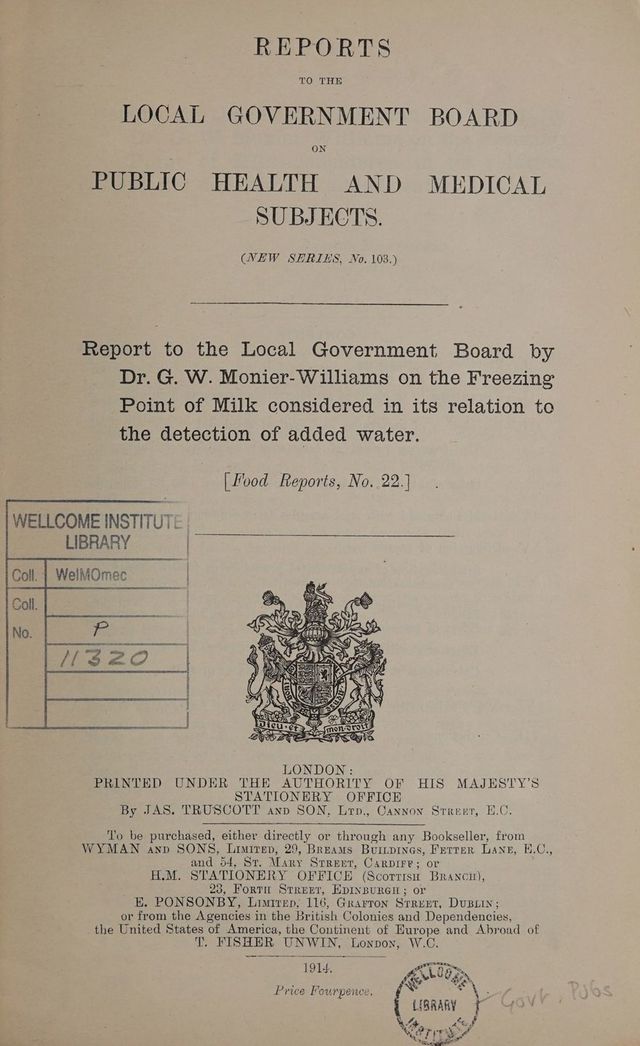 No text description is available for this image