Annual vaccination returns of the Province of Assam : with brief explanatory notes.
- Assam
- Date:
- [1925]
Licence: Public Domain Mark
Credit: Annual vaccination returns of the Province of Assam : with brief explanatory notes. Source: Wellcome Collection.
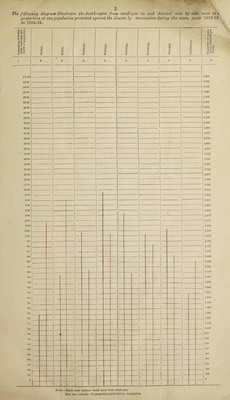
12/24 page 8
![A.—VACCINE Statement No. I—Showing particulars of Vaccination in No. District. Population of district according to the census of 1921. Average population per square mile. Average Dumber of vaccinators employed throughout the season. Total number of persons vaccinated. Average number of persons vacci¬ nated by each vaccinator. Primary O H Sue s 0> a o <y S3 P 1 2 3 4 6 6 7 8 9 1 2 3 4 5 6 7 8 9 10 11 12 13 14 Surma Valley and Hill Division. Cachar Sylhet Khasi and Jaintia Hills Naga Hills Lushai Hills Total of Surma Valley and Hill Division Assam Valley Division. Goalpara Kamrup Darrang Nowgong Sibsagar Lakhimpur Garo Hills Total of Assam Valley Division Manipur State ... ... Sadiya Frontier Tract Total Vaccine Department Total Dispensaries Tolal tea-gardens by garden agencies ... Total Jails, Mental hospital, Police hos¬ pitals and Infectious Diseases hospitals. Total Railways ... Grand Total 529,301 2,541,341 243,263 158,801 98,406 148 472 40 52 14 27 114 9 5 5 Male. 12,502 73,345 6,402 2,886 3,335 Female. 10,059 65,520 6,613 2,473 1,934 Total. 22,561 138,865 13,015 5,359 5,269 836 1,218 1,446 ] ,072 1,054 16,812 115,946 10,210 3,953 3,099 2,362 12,905 2,606 1,023 259 3,571,112 141 160 98,470 86,599 185,069 1,157 150,020 19,155 762,523 762,671 477,442 398,007 823,197 586.577 179,140 193 197 164 108 162 143 57 48 57 28 29 54 34 7 17,706 25,541 11,577 13,392 14,159 9.346 4,402 13,307 22,078 9,040 9,157 12,027 7,713 4,334 31,013 47,619 20,617 22,549 26,186 17,059 8,736 646 835 736 778 485 502 1,248 25,934 37,114 14,811 14,381 22,272 15,510 7,789 7,844 7,128 2,164 2,221 3,144 2,166 5,423 3,989,557 149 257 96,123 77,656 173,779 676 137,811 30,090 384,016 45 r 11 10,581 8,604 19,185 1,744 16,325 6,648 41,249 106 4 651 637 1,288 322 1,197 125 7,985,934 130 432 205,825 173,496 379,321 878 305,353 56,018 ... • • • ... ... ... | 2,961 ... 1,457 227 ... ... 17,283 15,960 33,243 ... 18,875 9,127 ... ... • • • 2,525 33 2,558 t • • 268 13 ... • • • 224 52 276 ... 78 6 7,985,934 130 432 225,857 189,541 418,359 878 326,031 65,391 Sum Total number of persons vaccinated. Total number of operations per f ormed Primary. Re-vaccinations. Primary. Re-vaccinations. l 2 3 4 & By special staff (Statement I) By dispensary staff (Statement III) By other agencies—tea-gardens, Railways, Jail hospitals, Police J hospitals, Mental hospital and Infectious Diseases hospitals. Total 305,353 1,457 19,221 73,968 1,504 16,856 305,353 1,457 19,221 73,968 1,504 16,856 326,031 92,328 326,031 92,328](https://iiif.wellcomecollection.org/image/b31495722_0012.jp2/full/800%2C/0/default.jpg)