The circulation time in the cat, studied by a conductivity method / by J.A.B. Gray and W.D.M. Paton.
- Gray, J. A. B.
- Date:
- [1949?]
Licence: In copyright
Credit: The circulation time in the cat, studied by a conductivity method / by J.A.B. Gray and W.D.M. Paton. Source: Wellcome Collection.
1/22
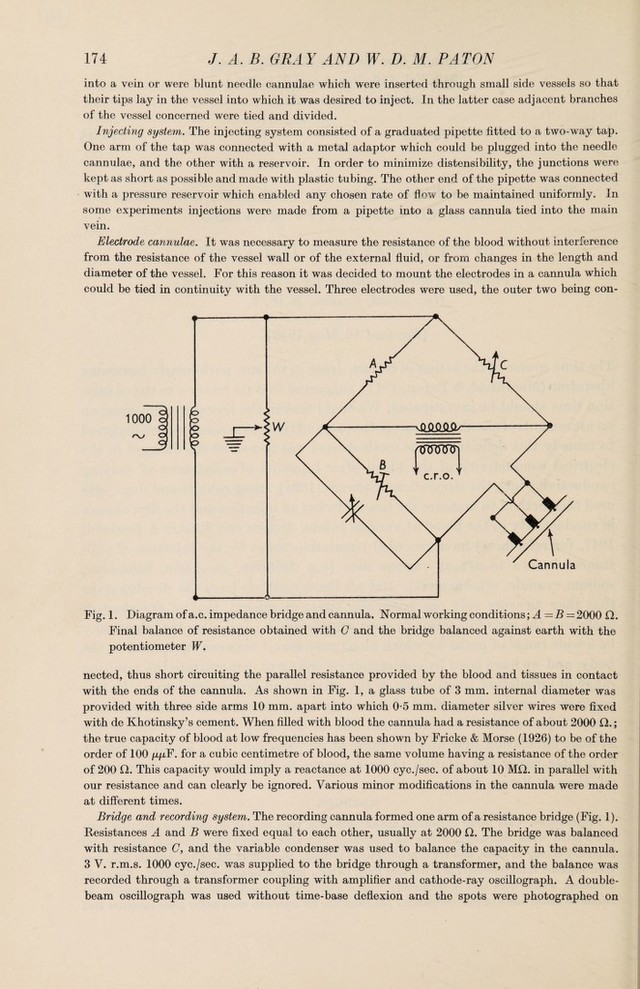
![[Reprinted from the Journal of Physiology, 1949, Yol. 110, Nos. 1 and 2, p. 173.] PRINTED IN GREAT BRITAIN J. Physiol. (1949) no, 173-193 612.15 THE CIRCULATION TIME IN THE CAT, STUDIED BY A CONDUCTIVITY METHOD By J. A. B. GRAY and W. D. M. PATON From the National Institute for Medical Research, Hampstead, London, N.W. 3. (Received 16 May 1949) The time course of the action of certain drugs in the cat, particularly histamine liberators (Macintosh & Paton, 1947), suggested that its relation to the circula¬ tion time should be investigated. We could find in the literature, however, no measurements of circulation time in the cat, and these experiments were designed to remedy this deficiency. The method used was to record the changes in the electrical conductivity of the blood after injection of substances'of varying conductivity into the circulation. Stewart (1894), using rabbits and dogs, also used this method to measure the time between an injection and the first change in conductivity in the blood at various points. Others (see Ruskin & Decherd, 1947, for references) have recorded circulation times by the injection of sub¬ stances known to act at various sites (e.g. decholin, saccharin, histamine, sodium cyanide, nikethamide). But all these methods have the disadvantage that they measure only one particular time; in general, that of the shortest path from the site of injection to some specific organ. It is clear that there may be a wide range of paths by which blood may travel between two points in the body, and we have tried by continuous recording to demonstrate the resulting range of circulation times, both in the greater and lesser circulation. In this paper we describe the method of recording time-concentration curves of a sub¬ stance injected into the circulation and of deducing from these curves the average circulation time and the cause of its variation. It is hoped to discuss in a later paper the relation of such curves to the action of certain drugs (cf. Gray & Paton, 1948). METHODS I I Preparations. Cats under chloralose anaesthesia have been used in all experiments; they were eviscerated when necessary. After all dissection had been completed, time was allowed for capillary oozing to cease, and for firm clots to be formed. Heparin (2 ml. of 1 % sodium salt) was then injected intravenously, and not less than 15 min. later, cannulae were inserted. Electrode cannulae, which were tied in continuity with a vessel, were inserted as quickly as possible to minimize disturbance of the circulation. The cannulae for injection were either glass cannulae tied](https://iiif.wellcomecollection.org/image/b3063281x_0001.jp2/full/800%2C/0/default.jpg)