The nation's food : a statistical study of a physiological and social problem / by Raymond Pearl.
- Raymond Pearl
- Date:
- 1920
Licence: In copyright
Credit: The nation's food : a statistical study of a physiological and social problem / by Raymond Pearl. Source: Wellcome Collection.
54/282 page 52
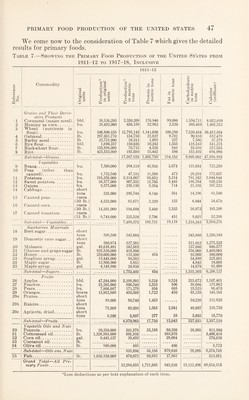
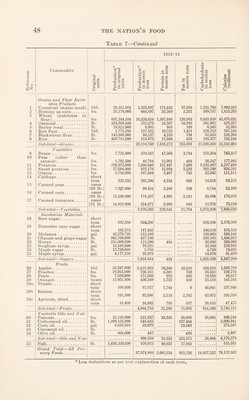
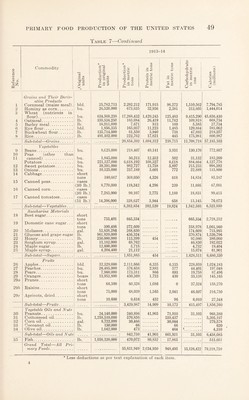
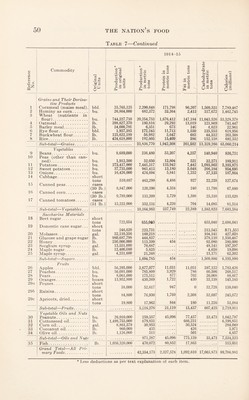
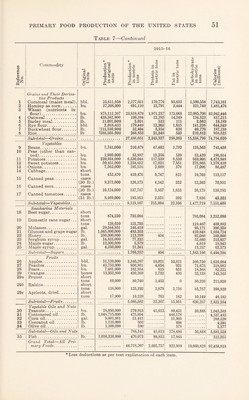
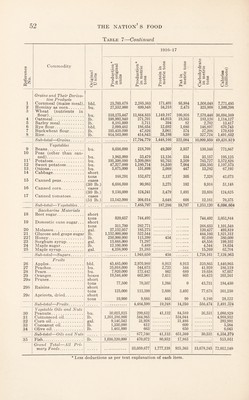
![Table 7—Continued j Reference No. Commodity Original U nits 1916- 17 Production * in original units Production* in metric tons 1 Protein in metric tons Fat in metric tons Carbohydrate in metric tons i Calories (millions) Grains and Their Deriva- — live Products 1 Cornmeal (maize meal). bbl. 25,705,678 2,285,363 171,401 95,984 1,506,048 7,771,495 2 Hominy as corn. bu. 27,552,000 699,848 34,218 2,475 325,808 1,500,206 3 Wheat (nutrients in flour). bu. 510,175,447 13,884,833 1,149,197 100,896 7,570,446 36,694,369 4 Oatmeal. lb. 598,992,840 271,701 44,015 19,563 183,126 1,114,127 5 Barley meal. lb. 8,181,000 3,711 394 82 2,702 13,417 6 Rye flour. bbl. 2,099,482 186,654 12,692 1,680 146,897 670,743 7 Buckwheat flour. lb. 105,438,000 47,826 3,061 574 37,208 170,810 8 Rice. lb. 914,563,000 414,843 33,188 830 327,724 1,491,652 Sub-total—Grains. • . • * • 17,794,779 1,448,166 222,084 10,099,959 49,426,819 V egetables 9 Beans. bu. 8,036,000 218,708 49,209 3,937 130,348 773,867 10 Peas (other than can- ned). bu. 1,965,000 53,479 13,156 534 33,157 195,125 11’ Potatoes. bu. 191,398,000 5,209,088 93,763 5,209 765,727 3,572,826 12 Sweet potatoes. bu. 47,327,000 1,180,714 16,530 7,084 258,595 1,197,373 13, Onions. bu. 5,875,000 151,898 2,089 447 13,282 67,192 14 Cabbage. short tons 168,291 152,672 2,137 305 7,328 42,073 15 Canned peas. cases (30 lb.) 6,686,000 90,983 3,275 182 8,916 51,148 16 Canned corn. cases (30 lb.) 9,130,000 124,241 3,479 1,491 23,606 124,625 17 Canned tomatoes. cases (51 lb.) 13,142,000 304,014 3,648 608 12,161 70,375 Sub-total—Vegetables . . . • . • • • 7,485,797 187,286 19,797 1,253,120 6,094,604 Saccharine Materials 18 Beet sugar. short tons 820,657 744,492 744,492 3,052,844 19 Domestic cane sugar. . . short tons 311,700 282,771 268,633 1,101,548 20 Molasses. gal. 37,132,057 185;273 120,427 493,819 21 Clncose and grape sugar lb 1,152,000,000 522,544 444460 1,82L312 22] Honey. lb. '250,000,000 113,399 454 92,080 380,000 23 Sorghum syrup. gaL 13,668;000 71,297 48'556 199,'l02 24 Maple sugar. lb. 12,100,000 5,489 4,544 18,634 25 Maple syrup. gal. 4,258,900 21,385 15,269 62,704 Sub-total—Sugars. . 1,946,650 454 1,738,161 7,129,963 Fruits 26 Apples. bbl. 45,485,000 2,970,989 8,913 8,913 320,865 1,440,965 27 Peaches. bu. 25,016,000 544,673 2,723 544 41,939 186,119 28 Pears. bu. 7,920,000 172,442 862 689 19,658 87,057 29 Oranges. boxes 19,546,400 602,901 2,411 603 46,423 203,361 29a Prunes. short tons 77,500 70,307 1,266 0 43,731 184,450 296 Raisins. short tons 125,000 113,399 2,608 3,402 77,678 361,250 29c Apricots, dried. short tons 10,900 9,888 465 99 6,180 28,122 Sub-total—Fruits. . 4,484,599 19,248 14,250 556,474 2,491,324 Vegetable Oils and Nuts 30 Peanuts. bu. 30,025,825 299,632 41,132 84,589 30,531 1,080,829 31 Cottonseed oil. lb. 1,201,386,000 544,945 534,044 4,968,932 32 Corn oil. gal. 9,140,542 3L928 3L486 '292;991 33 Cocoaniit oil. lb. 1,350,000 '612 600 5,584 34 Olive oil. lb. 1,461,000 663 650 6,043 Sub-total—Oils and Nuts 877,780 41,132 651,369 30,531 6,354,379 35 Fish. lb. 1,036,320,000 470,072 80,852 17,863 515,051 Grand Total—All Pri- mary Foods. 33,059,677 1,777,138 925,363 13,678,245 72,012,140](https://iiif.wellcomecollection.org/image/b29810875_0054.jp2/full/800%2C/0/default.jpg)