The nation's food : a statistical study of a physiological and social problem / by Raymond Pearl.
- Raymond Pearl
- Date:
- 1920
Licence: In copyright
Credit: The nation's food : a statistical study of a physiological and social problem / by Raymond Pearl. Source: Wellcome Collection.
56/282 page 54
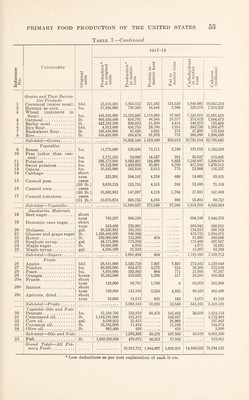
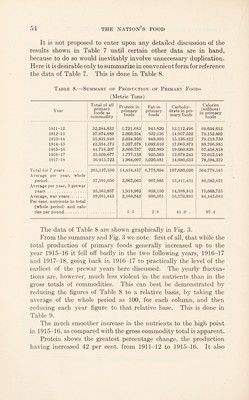
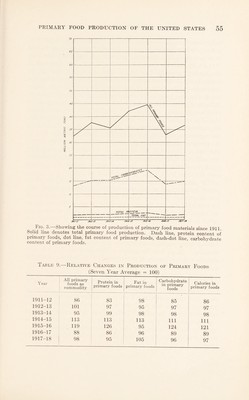
![It is not proposed to enter upon any detailed discussion of the results shown in Table 7 until certain other data are in hand, because to do so would inevitably involve unnecessary duplication. Here it is desirable only to summarize in convenient form for reference the data of Table 7. This is done in Table 8. Table 8.—Summary of Production of Primary Foods (Metric Tons) Year Total of all primary foods as commodity Protein in primary foods Fat in primary foods Carbohy¬ drate in pri¬ mary foods Calories (millions) in primary foods 1911-12 32,284,633 1,721,683 943,820 ]3,112,496 69,634,613 1912-13 37,974,989 2,003,254 922,136 14,957,522 78,152,802 1913-14 35,831,949 2,034,950 948,495 15,126,422 79,218,759 1914-15 42,354,173 2,327,578 1,092,610 17,063,873 89,706,981 1915-16 44,718,207 2,605,757 922,989 19,060,829 97,458,818 1916-17 33,059,677 1,777,138 925,363 13,678,245 72,012,140 1917-18 36,913,722 1,964,097 1,020,481 14,880,633 78,594,232 Total for 7 years. 263,137,350 14,434,457 6,775,894 107,880,020 564,778,345 Average per year, whole period. 37,591,050 2,062,065 967,985 15,411,431 80,682,621 Average per year, 3 prewar years. 35,363,857 1,919,962 938,150 14,398,813 75,668,725 Average, war years. 39,261,445 2,168,643 990,361 16,170,895 84,443,043 Per cent, nutrients to total (whole period) and calo- lies per pound. 5.5 2.6 41 .0 . 97.4 The data of Table 8 are shown graphically in Fig. 3. From the summary and Fig. 3 we note: first of all, that while the total production of primary foods generally increased up to the year 1915-16 it fell off badly in the two following years, 1916-17 and 1917-18, going back in 1916-17 to practically the level of the earliest of the prewar years here discussed. The yearly fluctua¬ tions are, however, much less violent in the nutrients than in the gross totals of commodities. This can best be demonstrated by reducing the figures of Table 8 to a relative basis, by taking the average of the whole period as 100, for each column, and then reducing each year figure to that relative base. This is done in Table 9. The much smoother increase in the nutrients to the high point in 1915-16, as compared with the gross commodity total is apparent. Protein shows the greatest percentage change, the production having increased 42 per cent, from 1911-12 to 1915-16. It also](https://iiif.wellcomecollection.org/image/b29810875_0056.jp2/full/800%2C/0/default.jpg)