Vital statistics of Glasgow, illustrating the sanatory condition of the population / by Robert Cowan, M.D.
- Robert Cowan
- Date:
- [1840]
Licence: Public Domain Mark
Credit: Vital statistics of Glasgow, illustrating the sanatory condition of the population / by Robert Cowan, M.D. Source: Wellcome Collection.
Provider: This material has been provided by The University of Glasgow Library. The original may be consulted at The University of Glasgow Library.
1/36
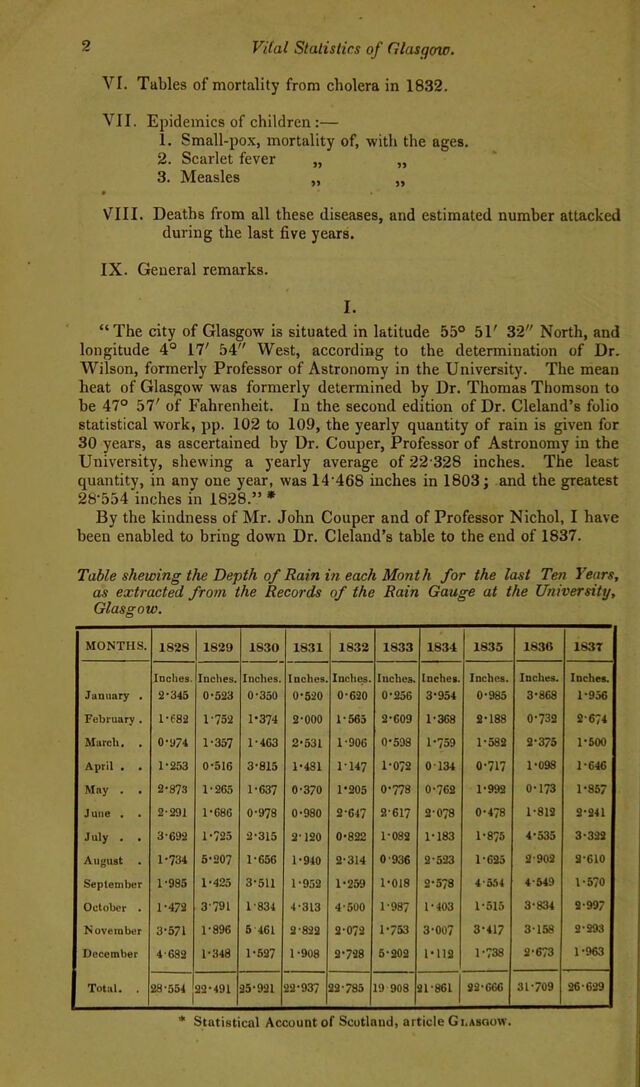
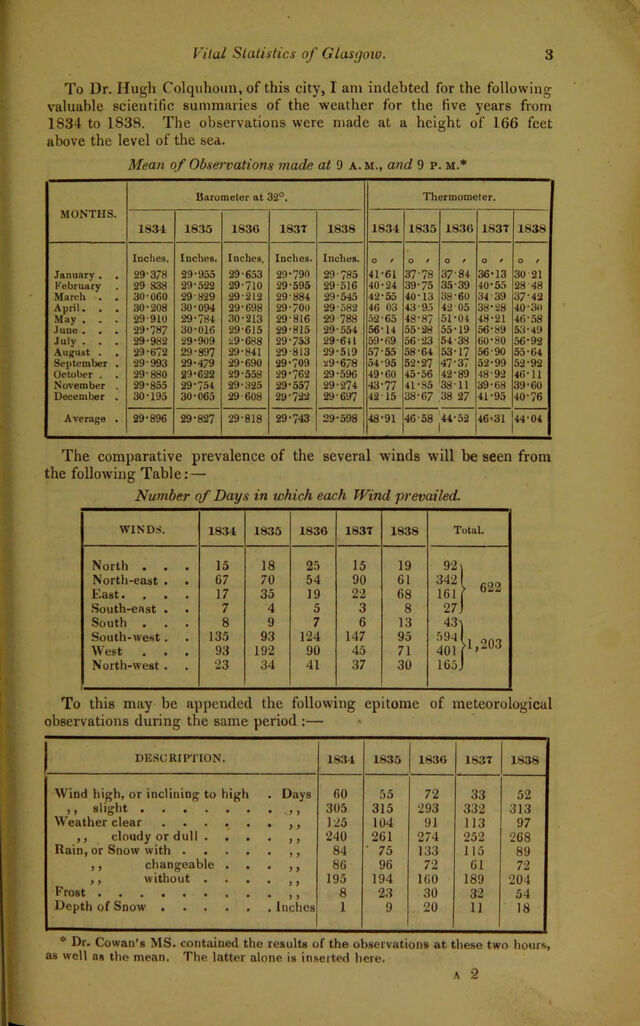
![VITAL STATISTICS OF GLASGOW, m ILLUSTRATING THE SANATORY CONDITION OF THE POPULATION. By ROBERT COWAN, M.D., Professor of Medical Jurisprudence and Polico in the University of Glasgow. [Readbefore the Statistical Section of the British Association, 21st.September 1840.] __ “La misere, avec les privations qu’elle amene it sa suite, est uue des causes les plus inflaentes sur la mortality.”—Quetelkt. In tlie following paper it is proposed to lay before the Statistical Section of the British Association— I. Tables of the climate of Glasgow—of the progress of the popu- lation—of the marriages, births, and deaths, and the ratio which they bear to the estimated population—of the still-born, and the baptisms, distinguishing males and females, and their relative proportion—of the deaths under five years of age—of the relative mortality under, at, and above five years of age—of the relative mortality of the different months and seasons of the year—of the increase and decrease of deaths at each age, and of the proportion of burials at the public expense. II. Causes of the high rate of mortality in Glasgow—existence of epidemic diseases affecting the adult and infantile portions of the popu- lation respectively—tables of the numbers affected with fever treated in the hospitals of Glasgow—and in their own houses at the public expense, within the burgh—of the deaths from fever during the last five years, in the city and suburbs—of the estimated numbers attacked —of the deaths monthly from fever, for four years, distinguishing the sexes, and giving the proportion to the whole deaths monthly. III. Number of persons admitted into the Fever Hospital, distinguish- ing the country, sex and age of each individual—the mortality at each interval of age, distinguishing males and females, with a combined table of the deaths at each age—of the numbers exposed to contagion—of the numbers in whom eruption appeared—of the mortality of the eruptive and non-eruptive cases. IV. Map of the city, shewing the d: vision of the districts, and the number of fever patients in each. V. Tables of mortality from influenza in 1837.](https://iiif.wellcomecollection.org/image/b24917448_0003.jp2/full/800%2C/0/default.jpg)